README.md
In hughjonesd/anim.plots: Simple Animated Plots for R
anim.plots


anim.plots provides simple animated versions of basic R plots, using the animation
package. It includes animated versions of plot, barplot, persp, contour,
filled.contour, hist, curve, points, lines, text, symbols, segments, and
arrows.
Installation
Stable version from CRAN:
install.packages("anim.plots")
Latest version from github:
# install.packages("devtools")
devtools::install_github("anim.plots/hughjonesd")
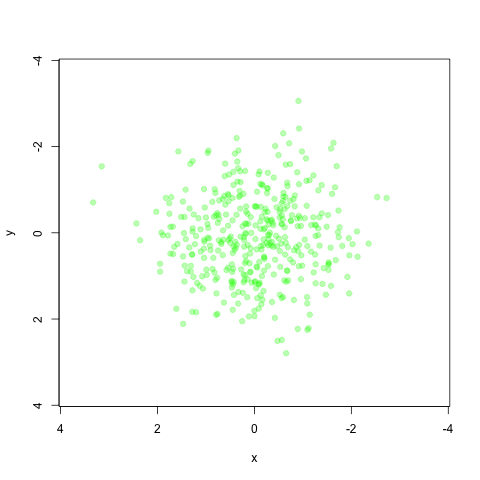
Example
Zooming into a bivariate normal distribution:
x <- rep(rnorm(400), 10)
y <- rep(rnorm(400), 10)
xlims <- 4 * 2^-(1:10/10)
ylims <- xlims <- rbind(xlims, -xlims)
anim.plot(x, y, times = 10, speed = 2, xlim = xlims, ylim = ylims, col = rgb(0,1,0,.3), pch = 19)
More information
Feedback
Got a nice example?
Tweet it.
hughjonesd/anim.plots documentation built on June 13, 2025, 11:26 a.m.
R Package Documentation
Browse R Packages
We want your feedback!
Note that we can't provide technical support on individual packages. You should contact the package authors for that.
anim.plots
![]()
![]()
anim.plots provides simple animated versions of basic R plots, using the animation
package. It includes animated versions of plot, barplot, persp, contour,
filled.contour, hist, curve, points, lines, text, symbols, segments, and
arrows.
Installation
Stable version from CRAN:
install.packages("anim.plots")
Latest version from github:
# install.packages("devtools")
devtools::install_github("anim.plots/hughjonesd")
Example
Zooming into a bivariate normal distribution:
x <- rep(rnorm(400), 10)
y <- rep(rnorm(400), 10)
xlims <- 4 * 2^-(1:10/10)
ylims <- xlims <- rbind(xlims, -xlims)
anim.plot(x, y, times = 10, speed = 2, xlim = xlims, ylim = ylims, col = rgb(0,1,0,.3), pch = 19)
More information
Feedback
Got a nice example? Tweet it.
R Package Documentation
Browse R Packages
We want your feedback!
Note that we can't provide technical support on individual packages. You should contact the package authors for that.
Embedding an R snippet on your website
Add the following code to your website.
For more information on customizing the embed code, read Embedding Snippets.