In jonocarroll/ggeasy: Easy Access to 'ggplot2' Commands
knitr::opts_chunk$set(
  collapse = TRUE,
  comment = "#>",
  fig.path = "man/figures/"
)
ggeasy 


You know how to make ggplot2 graphics, right? No worries. Piece of cake.
Now, can you please rotate the x axis labels to vertical?
ggeasy is here to make that a little easier.
Installation
You can install the latest released version of ggeasy from CRAN with:
install.packages("ggeasy")
or the bleeding-edge development version from GitHub with
# install.packages("remotes")
remotes::install_github("jonocarroll/ggeasy")
Reference
See the pkgdown site.
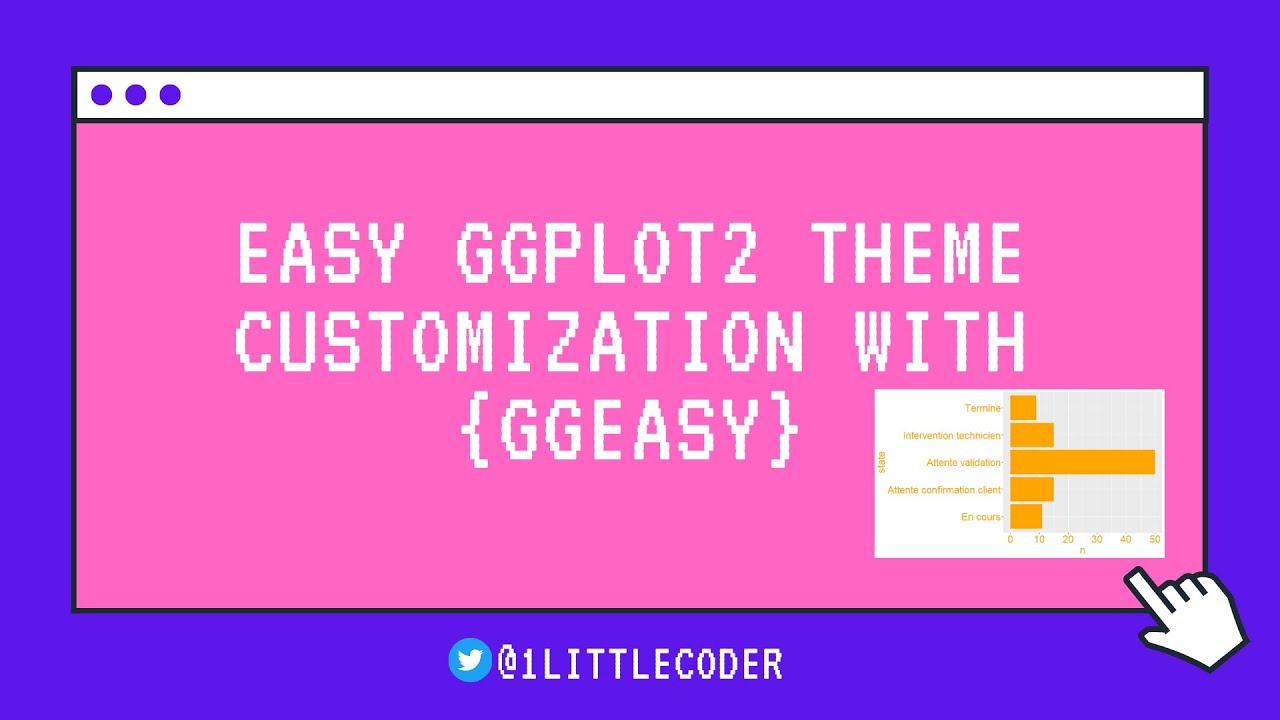
\@amrrs a.k.a. \@1littlecoder has produced a video walkthrough using ggeasy which covers some of the major features:
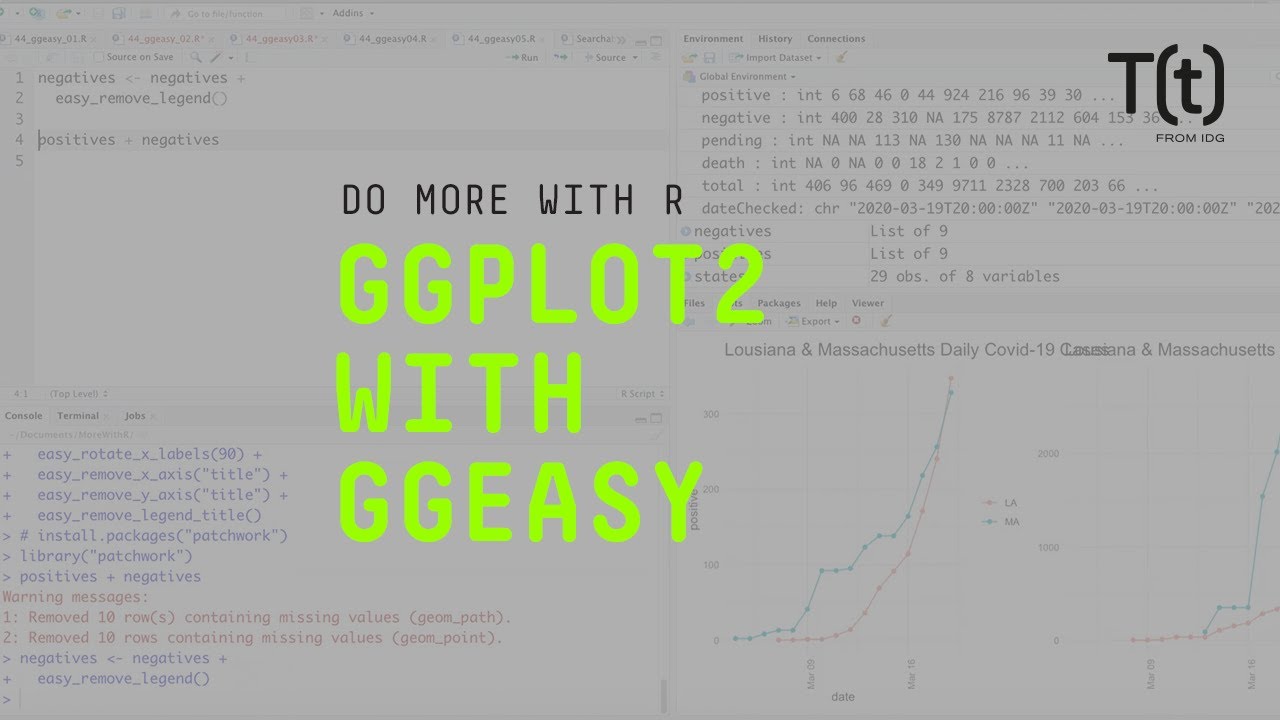
Sharon Machlis has a great article detailing using the package, as well as a video
Examples
library(ggplot2)
library(ggeasy)

# rotate x axis labels
ggplot(mtcars, aes(hp, mpg)) +
    geom_point() +
    easy_rotate_x_labels()

# rotate y axis labels
ggplot(mtcars, aes(hp, mpg)) +
    geom_point() +
    easy_rotate_y_labels()

# remove 'size' legend
ggplot(mtcars, aes(wt, mpg, colour = cyl, size = hp)) +
    geom_point() +
    easy_remove_legend(size)

# make the x axis labels larger
ggplot(mtcars, aes(mpg, hp)) +
  geom_point() +
  easy_x_axis_labels_size(22)

# make all the text red
ggplot(mtcars, aes(mpg, hp)) +
  geom_point(aes(fill = gear)) +
  easy_all_text_color("red")

# remove just x axis
ggplot(mtcars, aes(wt, mpg)) +
  geom_point() +
  easy_remove_x_axis()

# remove y axis ticks
ggplot(mtcars, aes(wt, mpg)) +
  geom_point() +
  easy_remove_y_axis(what = "ticks")

# move legends to bottom
ggplot(mtcars, aes(wt, mpg, colour = cyl, size = hp)) +
  geom_point() +
  easy_move_legend("bottom")

# move legend to left side
ggplot(mtcars, aes(wt, mpg, colour = cyl, size = hp)) +
  geom_point() +
  easy_legend_at("left")

# Make legends horizontal
ggplot(mtcars, aes(wt, mpg, colour = cyl, size = hp)) +
  geom_point() + easy_rotate_legend("horizontal")

# use labelled variables
iris_labs <- iris
labelled::var_label(iris_labs$Species) <- "Flower\nSpecies"
labelled::var_label(iris_labs$Sepal.Length) <- "Length of Sepal"
iris_labs_2 <- iris_labs
labelled::var_label(iris_labs_2$Species) <- "Sub-genera"

# use variable labels automatically
ggplot(iris_labs, aes(x = Sepal.Length, y = Sepal.Width)) +
    geom_line(aes(colour = Species)) +
    geom_point(data = iris_labs_2, aes(fill = Species), shape = 24) +
    easy_labs()
These functions will try to teach you the 'official' way to achieve these goal,
usually via the teach argument (where implemented)
ggplot(mtcars, aes(hp, mpg)) +
    geom_point() +
    easy_rotate_y_labels(angle = "startatbottom", teach = TRUE)

ggplot(mtcars, aes(wt, mpg)) +
  geom_point() +
  easy_remove_y_axis(what = "ticks", teach = TRUE)
Credits
Many thanks to Sébastien Rochette (\@statnmap) for
the design and execution of the hex logo.
jonocarroll/ggeasy documentation built on March 17, 2023, 5:54 p.m.
R Package Documentation
Browse R Packages
We want your feedback!
Note that we can't provide technical support on individual packages. You should contact the package authors for that.
knitr::opts_chunk$set( collapse = TRUE, comment = "#>", fig.path = "man/figures/" )
ggeasy
![]()
![]()
![]()
You know how to make ggplot2 graphics, right? No worries. Piece of cake.
Now, can you please rotate the x axis labels to vertical?
ggeasy is here to make that a little easier.
Installation
You can install the latest released version of ggeasy from CRAN with:
install.packages("ggeasy")
or the bleeding-edge development version from GitHub with
# install.packages("remotes") remotes::install_github("jonocarroll/ggeasy")
Reference
See the pkgdown site.
\@amrrs a.k.a. \@1littlecoder has produced a video walkthrough using ggeasy which covers some of the major features:
Sharon Machlis has a great article detailing using the package, as well as a video
Examples
library(ggplot2) library(ggeasy) # rotate x axis labels ggplot(mtcars, aes(hp, mpg)) + geom_point() + easy_rotate_x_labels() # rotate y axis labels ggplot(mtcars, aes(hp, mpg)) + geom_point() + easy_rotate_y_labels() # remove 'size' legend ggplot(mtcars, aes(wt, mpg, colour = cyl, size = hp)) + geom_point() + easy_remove_legend(size) # make the x axis labels larger ggplot(mtcars, aes(mpg, hp)) + geom_point() + easy_x_axis_labels_size(22) # make all the text red ggplot(mtcars, aes(mpg, hp)) + geom_point(aes(fill = gear)) + easy_all_text_color("red") # remove just x axis ggplot(mtcars, aes(wt, mpg)) + geom_point() + easy_remove_x_axis() # remove y axis ticks ggplot(mtcars, aes(wt, mpg)) + geom_point() + easy_remove_y_axis(what = "ticks") # move legends to bottom ggplot(mtcars, aes(wt, mpg, colour = cyl, size = hp)) + geom_point() + easy_move_legend("bottom") # move legend to left side ggplot(mtcars, aes(wt, mpg, colour = cyl, size = hp)) + geom_point() + easy_legend_at("left") # Make legends horizontal ggplot(mtcars, aes(wt, mpg, colour = cyl, size = hp)) + geom_point() + easy_rotate_legend("horizontal") # use labelled variables iris_labs <- iris labelled::var_label(iris_labs$Species) <- "Flower\nSpecies" labelled::var_label(iris_labs$Sepal.Length) <- "Length of Sepal" iris_labs_2 <- iris_labs labelled::var_label(iris_labs_2$Species) <- "Sub-genera" # use variable labels automatically ggplot(iris_labs, aes(x = Sepal.Length, y = Sepal.Width)) + geom_line(aes(colour = Species)) + geom_point(data = iris_labs_2, aes(fill = Species), shape = 24) + easy_labs()
These functions will try to teach you the 'official' way to achieve these goal,
usually via the teach argument (where implemented)
ggplot(mtcars, aes(hp, mpg)) + geom_point() + easy_rotate_y_labels(angle = "startatbottom", teach = TRUE) ggplot(mtcars, aes(wt, mpg)) + geom_point() + easy_remove_y_axis(what = "ticks", teach = TRUE)
Credits
Many thanks to Sébastien Rochette (\@statnmap) for the design and execution of the hex logo.
R Package Documentation
Browse R Packages
We want your feedback!
Note that we can't provide technical support on individual packages. You should contact the package authors for that.
Embedding an R snippet on your website
Add the following code to your website.
For more information on customizing the embed code, read Embedding Snippets.