README.md
In joshua-james-f/DiscDots:
DiscDots
NOTE: This package is still in development and not ready for use
Overview
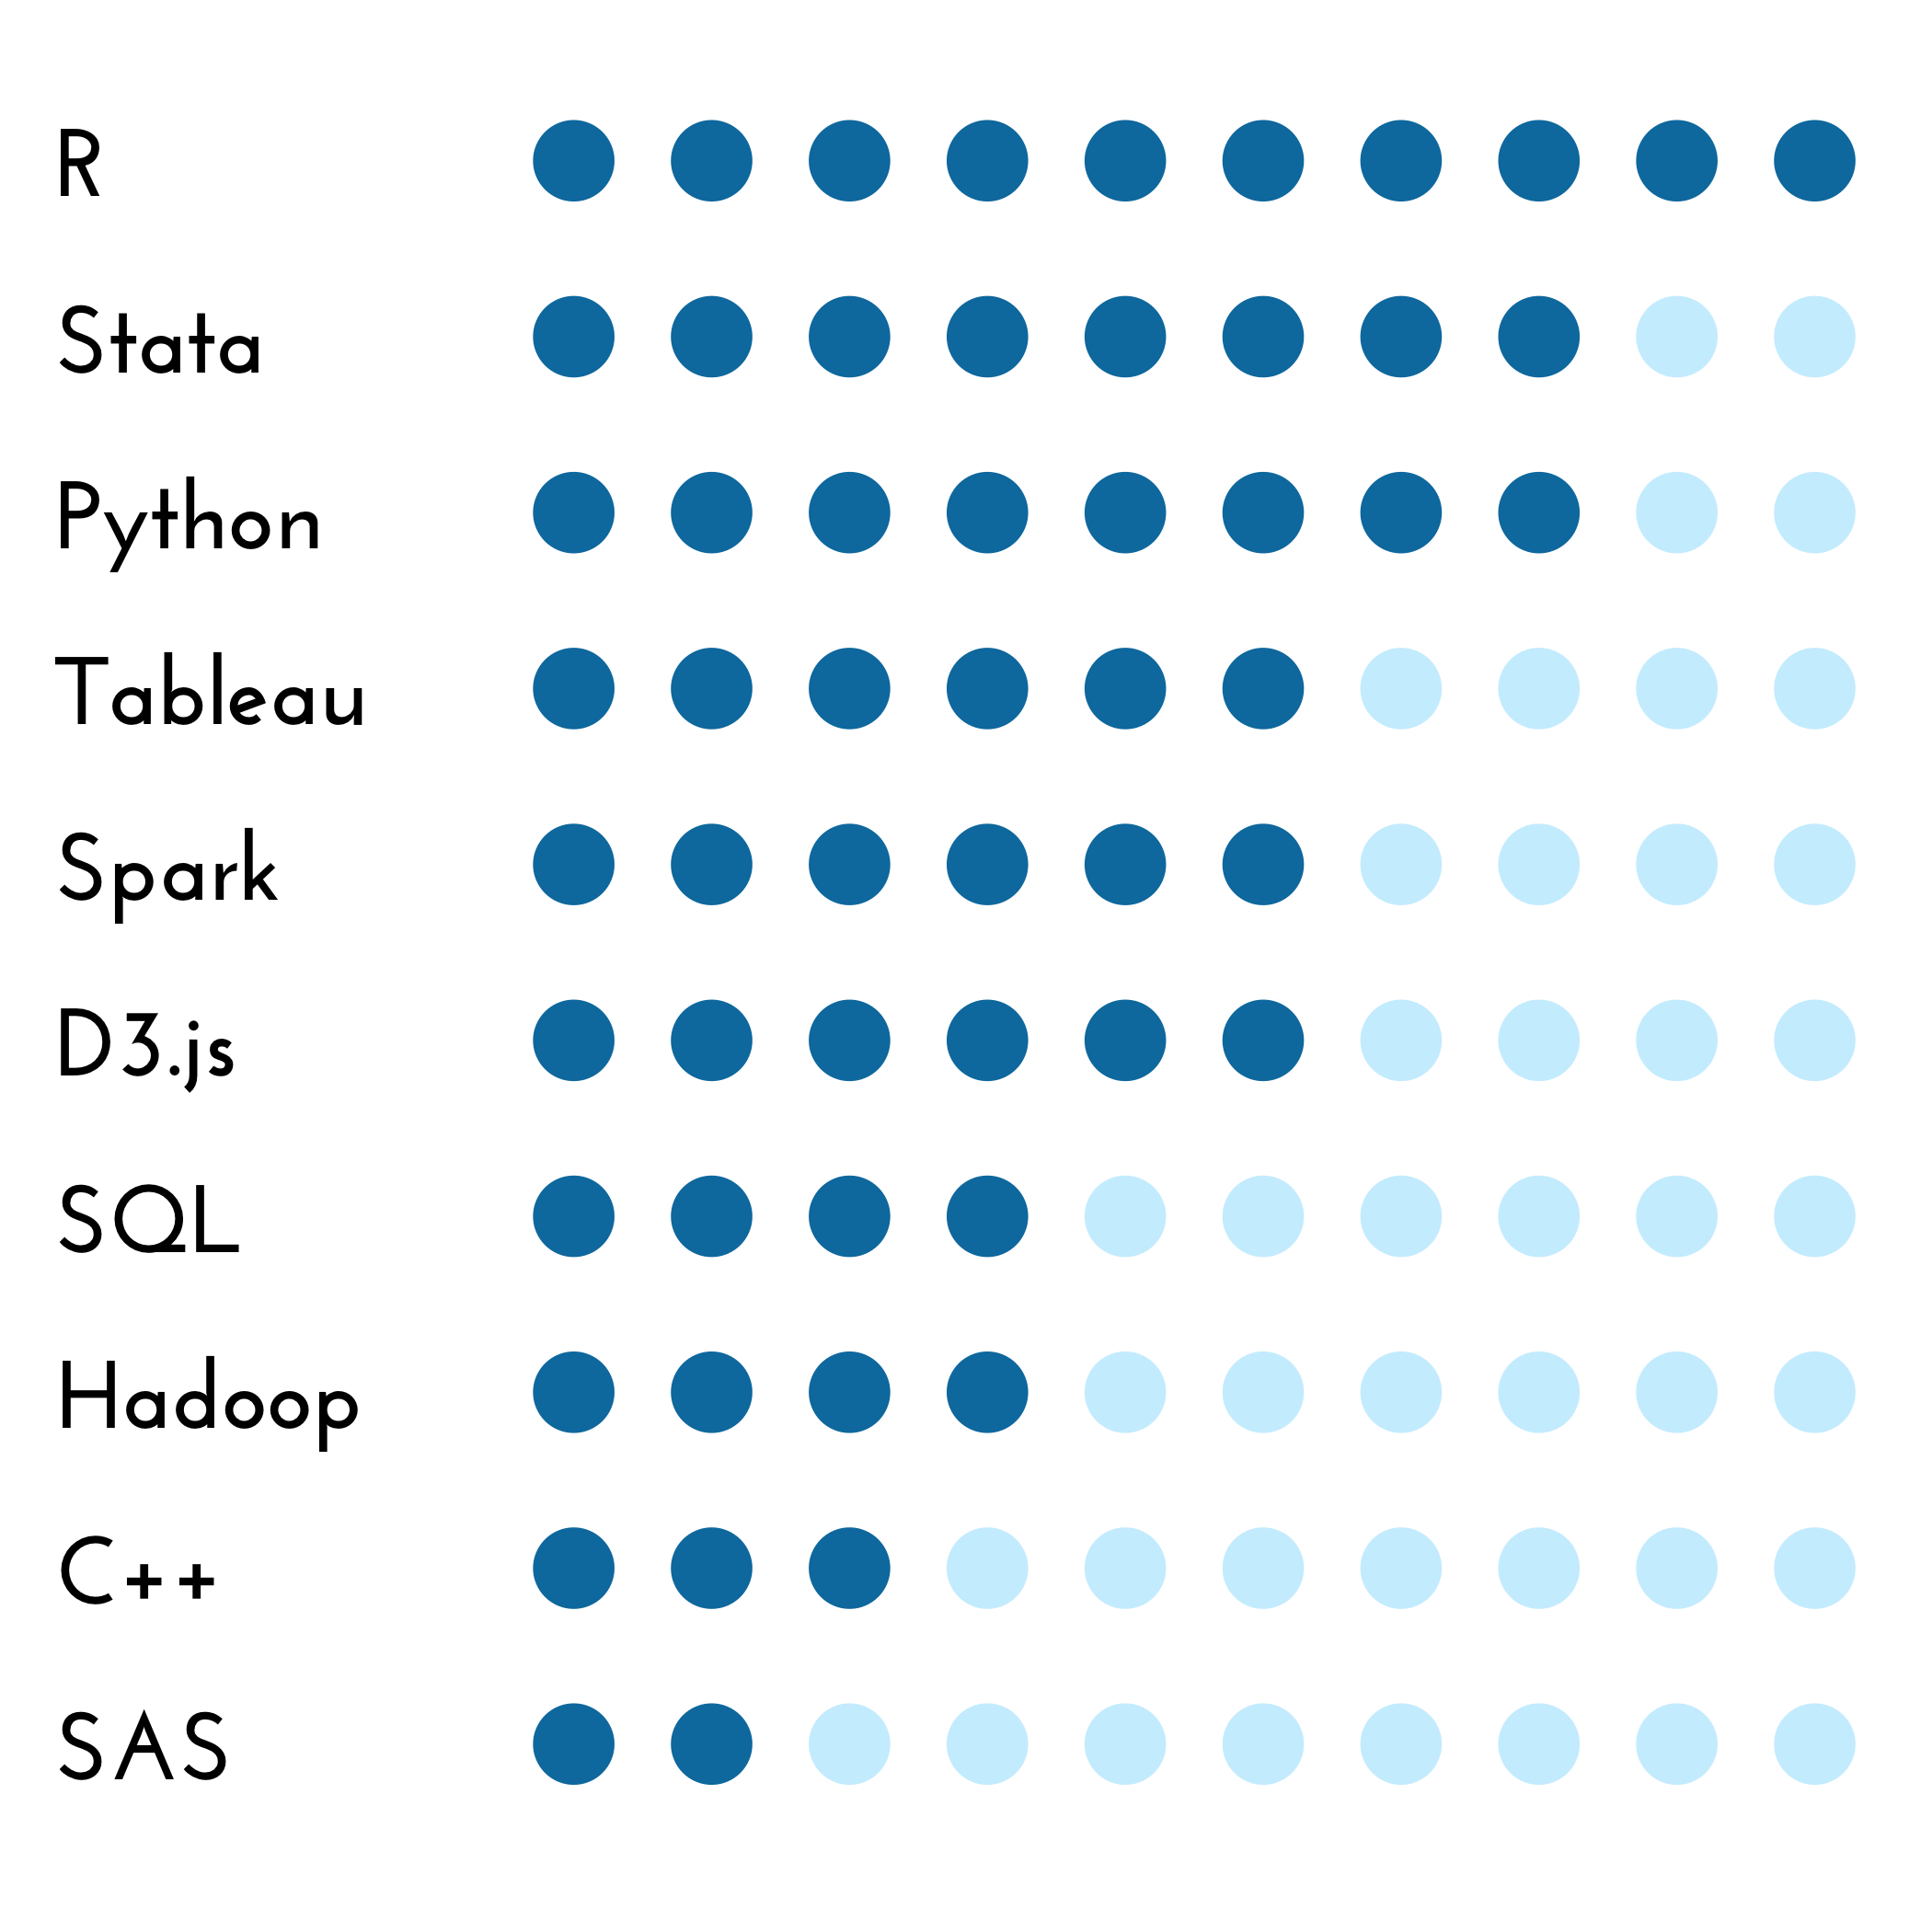
Discrete dot plots built on ggplot2
Install
Install the development version from github with the
devtools package,
library(devtools)
install_github("joshua-james-f/DiscDots")
Example
library(DiscDots)
values <- c(10, 8, 8, 6, 6, 6, 5, 4, 3, 2)
col_names <- c("R", "Python", "Stata", "D3.js", "Tableau", "Spark", "SQL", "Hadoop", "C++", "SAS")

DiscDots(values, var_names=col_names)
Note: Package still in development
joshua-james-f/DiscDots documentation built on May 19, 2019, 8:54 p.m.
R Package Documentation
Browse R Packages
We want your feedback!
Note that we can't provide technical support on individual packages. You should contact the package authors for that.
DiscDots
NOTE: This package is still in development and not ready for use
Overview
Discrete dot plots built on ggplot2
Install
Install the development version from github with the devtools package,
library(devtools)
install_github("joshua-james-f/DiscDots")
Example
library(DiscDots)
values <- c(10, 8, 8, 6, 6, 6, 5, 4, 3, 2)
col_names <- c("R", "Python", "Stata", "D3.js", "Tableau", "Spark", "SQL", "Hadoop", "C++", "SAS")
DiscDots(values, var_names=col_names)
Note: Package still in development
R Package Documentation
Browse R Packages
We want your feedback!
Note that we can't provide technical support on individual packages. You should contact the package authors for that.
Embedding an R snippet on your website
Add the following code to your website.
For more information on customizing the embed code, read Embedding Snippets.