In jvcasillas/contributoR: A package for documenting scholarly contributions
library(knitr)
contributoR
An R package for documenting scholarly contributions.
Last update: r Sys.Date()
Overview
The goal of contributoR is to facilitate the documentation of scholarly contributions.
This package uses CRediT (Contributor Roles Taxonomy) to visualize contributor roles.
Specifically, CRediT is a "high-level taxonomy, including 14 roles, that can be used to represent the roles typically played by contributors to scientific scholarly output.
The roles describe each contributor's specific contribution to the scholarly output" (see website for more details: https://casrai.org/credit/).
There are 14 roles, which are defined as follows:
- Conceptualization: Ideas; formulation or evolution of overarching research goals and aims.
- Data curation: Management activities to annotate (produce metadata), scrub data and maintain research data (including software code, where it is necessary for interpreting the data itself) for initial use and later re-use.
- Formal analysis: Application of statistical, mathematical, computational, or other formal techniques to analyze or synthesize study data.
- Funding acquisition: Acquisition of the financial support for the project leading to this publication.
- Investigation: Conducting a research and investigation process, specifically performing the experiments, or data/evidence collection.
- Methodology: Development or design of methodology; creation of models.
- Project administration – Management and coordination responsibility for the research activity planning and execution.
- Resources: Provision of study materials, reagents, materials, patients, laboratory samples, animals, instrumentation, computing resources, or other analysis tools.
- Software: Programming, software development; designing computer programs; implementation of the computer code and supporting algorithms; testing of existing code components.
- Supervision: Oversight and leadership responsibility for the research activity planning and execution, including mentorship external to the core team.
- Validation: Verification, whether as a part of the activity or separate, of the overall replication/reproducibility of results/experiments and other research outputs.
- Visualization: Preparation, creation and/or presentation of the published work, specifically visualization/data presentation.
- Writing – original draft: Preparation, creation and/or presentation of the published work, specifically writing the initial draft (including substantive translation).
- Writing – review & editing: Preparation, creation and/or presentation of the published work by those from the original research group, specifically critical review, commentary or revision – including pre- or post-publication stages.
Installation
You can install the development version from GitHub with:
install.packages("devtools")
devtools::install_github("jvcasillas/contributoR")
Usage
To create a CRediT visualization you need to use the contributor function.
This function takes a single argument, a list, which assigns any of the 14 contributor roles to an individual.
In other words, the name of the list element is the name of the contributor and any numbers included for that individual correspond with 1-14 in the list of roles.
For example...
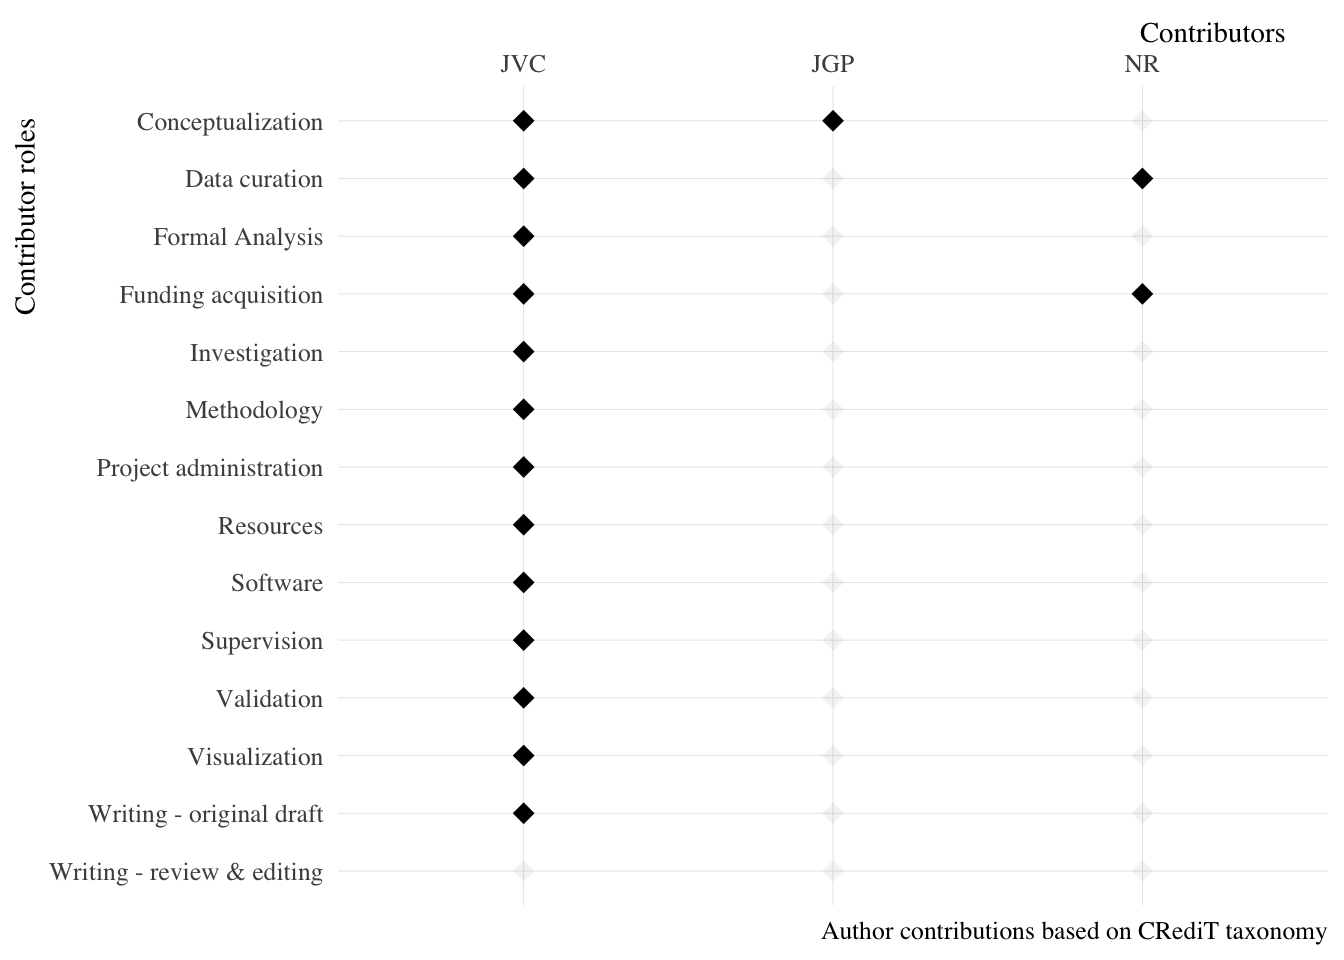
library("contributoR")

# Create example list
ex_1 <- list(
 JVC = 1:13,
 JGP = 1,
 NR  = c(2, 4))

# Plot contributions
contributor(contributions = ex_1)
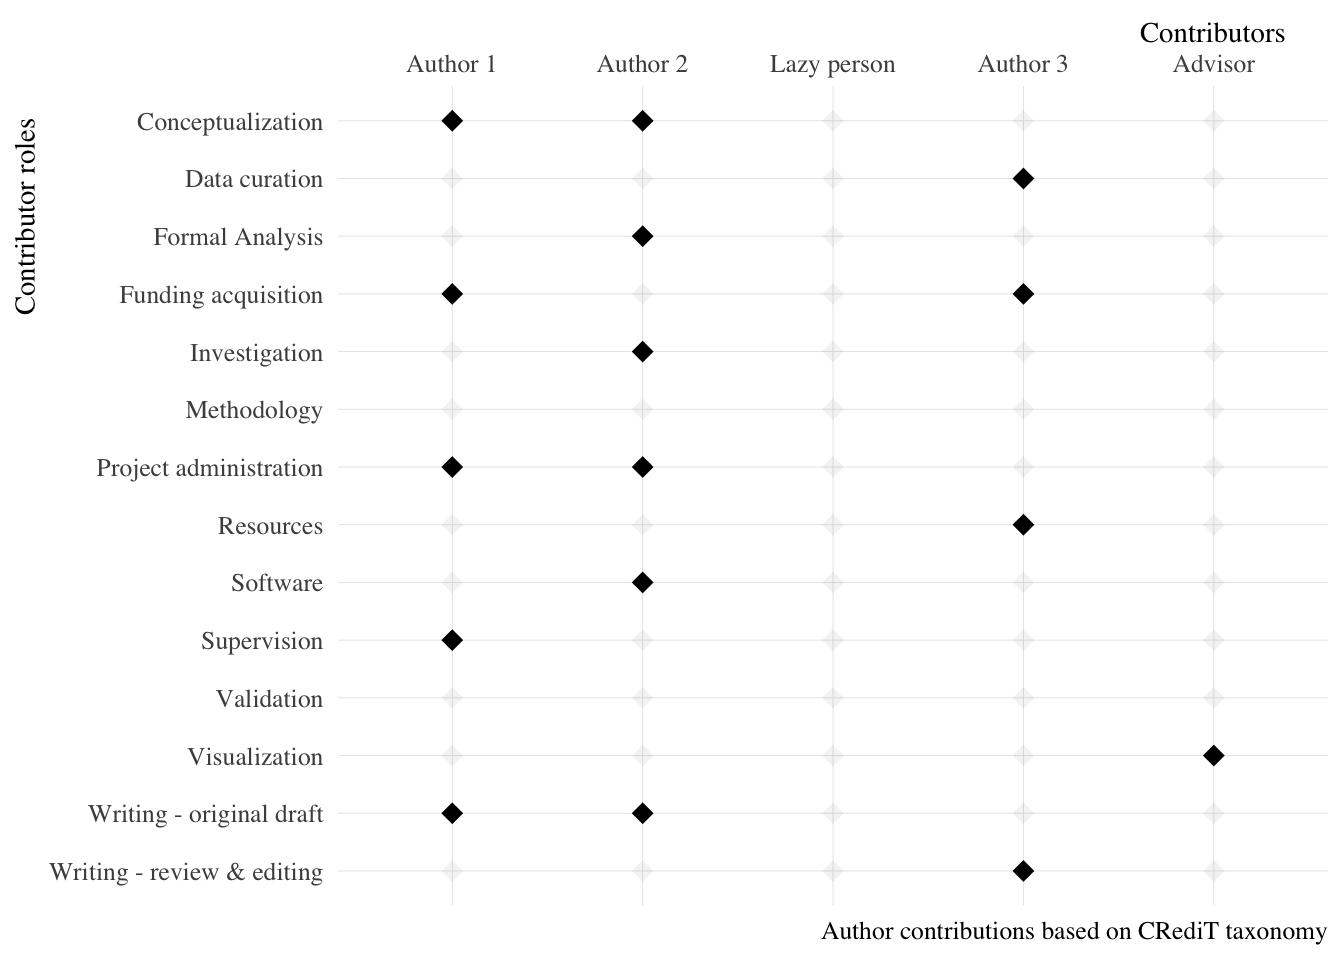
You can also build the list directly inside the contributor function.
# Build list inside function
contributor(
 contributions = list(
   "Author 1" = seq(1, 14, by = 3),
   "Author 2" = c(1, 3, 5, 7, 9, 13),
   "Lazy person" = NA,
   "Author 3" = c(2, 4, 8, 14),
   "Advisor" = 12)
   )
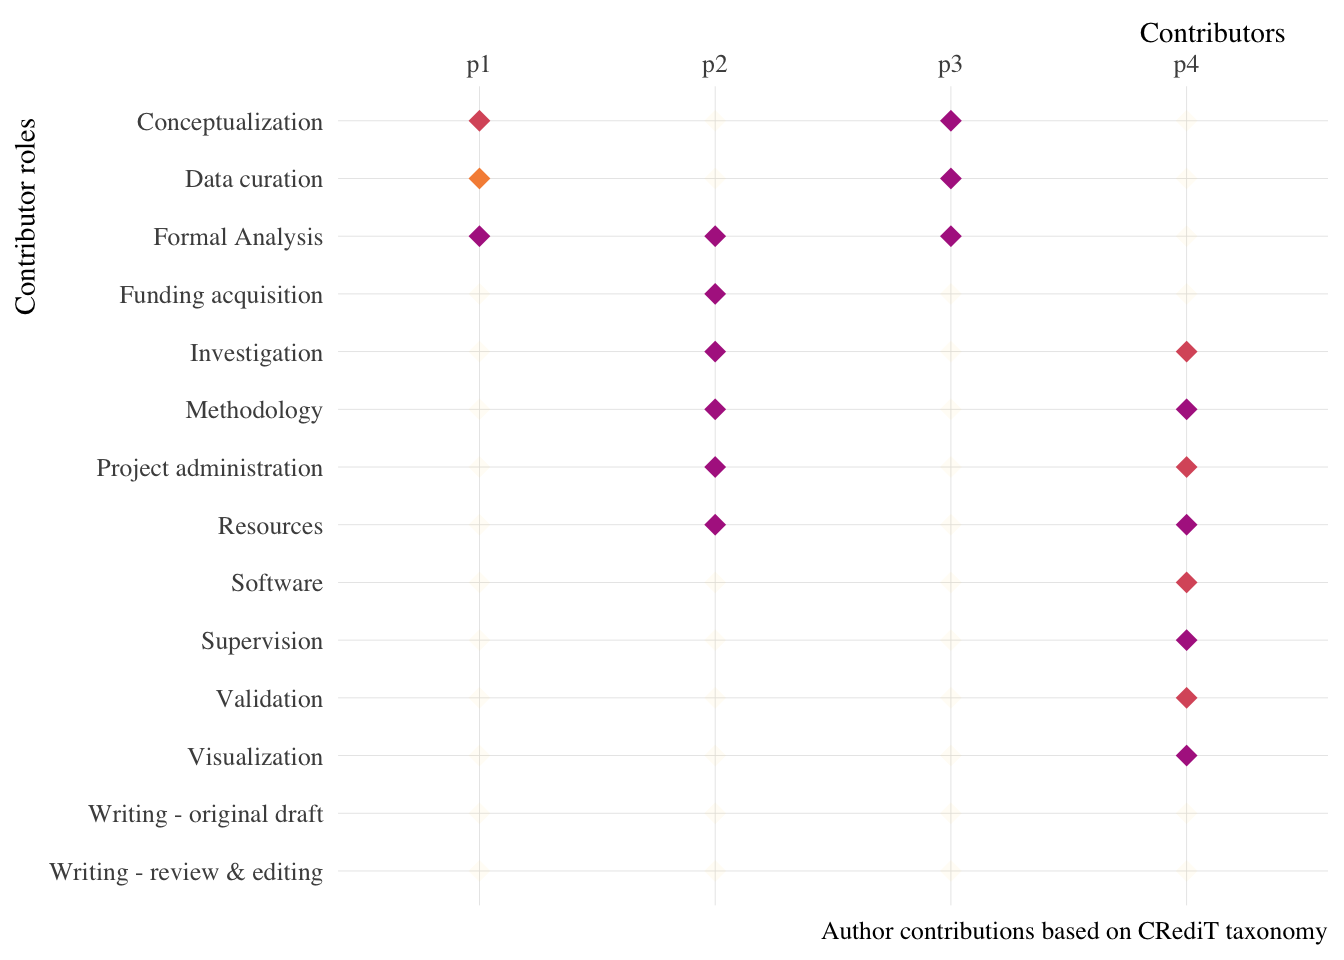
Experimental
It is also possible to quantify how much one contributes by adding weight to the list. For example:
contributions <- list(
  p1 = tibble::tibble(role = 1:3, weight = c("low", "med", "high")),
  p2 = tibble::tibble(role = 3:8, weight = "high"),
  p3 = tibble::tibble(role = 1:3, weight = "high"),
  p4 = tibble::tibble(role = 5:12, weight = rep(c("low", "high"), times = 4)))

contributor(contributions, weight = T, option = "C", begin = 0.4, end = 0.9)
If weights are included, the plot generates points that differ in color based on the number of weights specified in the list.
By default contributor uses the viridis color palettes for discrete variables, thus it is possible to include arguments like option, begin, and end to customize the point colors.
It is also possible to use the dataframe generated by contributoR to print contributions in prose.
This can be useful if you have a large list of co-authors.
contributions_in_prose <- contributor_df_builder(ex_1) |>
  contribution_to_text()
Now I can use in-line R code to print contributions_in_prose like this:
The authors made the following contributions: `r contributions_in_prose`
to_print <- contributoR::contributor_df_builder(
  list(
    JVC = 1:13,
    JGP = 1,
    NR  = c(2, 4)
  )
) |>
  contributoR::contribution_to_text()
The authors made the following contributions: r to_print
jvcasillas/contributoR documentation built on Dec. 18, 2024, 12:42 p.m.
R Package Documentation
Browse R Packages
We want your feedback!
Note that we can't provide technical support on individual packages. You should contact the package authors for that.
library(knitr)
contributoR
An R package for documenting scholarly contributions.
Last update: r Sys.Date()
Overview
The goal of contributoR is to facilitate the documentation of scholarly contributions. This package uses CRediT (Contributor Roles Taxonomy) to visualize contributor roles.
Specifically, CRediT is a "high-level taxonomy, including 14 roles, that can be used to represent the roles typically played by contributors to scientific scholarly output. The roles describe each contributor's specific contribution to the scholarly output" (see website for more details: https://casrai.org/credit/).
There are 14 roles, which are defined as follows:
- Conceptualization: Ideas; formulation or evolution of overarching research goals and aims.
- Data curation: Management activities to annotate (produce metadata), scrub data and maintain research data (including software code, where it is necessary for interpreting the data itself) for initial use and later re-use.
- Formal analysis: Application of statistical, mathematical, computational, or other formal techniques to analyze or synthesize study data.
- Funding acquisition: Acquisition of the financial support for the project leading to this publication.
- Investigation: Conducting a research and investigation process, specifically performing the experiments, or data/evidence collection.
- Methodology: Development or design of methodology; creation of models.
- Project administration – Management and coordination responsibility for the research activity planning and execution.
- Resources: Provision of study materials, reagents, materials, patients, laboratory samples, animals, instrumentation, computing resources, or other analysis tools.
- Software: Programming, software development; designing computer programs; implementation of the computer code and supporting algorithms; testing of existing code components.
- Supervision: Oversight and leadership responsibility for the research activity planning and execution, including mentorship external to the core team.
- Validation: Verification, whether as a part of the activity or separate, of the overall replication/reproducibility of results/experiments and other research outputs.
- Visualization: Preparation, creation and/or presentation of the published work, specifically visualization/data presentation.
- Writing – original draft: Preparation, creation and/or presentation of the published work, specifically writing the initial draft (including substantive translation).
- Writing – review & editing: Preparation, creation and/or presentation of the published work by those from the original research group, specifically critical review, commentary or revision – including pre- or post-publication stages.
Installation
You can install the development version from GitHub with:
install.packages("devtools")
devtools::install_github("jvcasillas/contributoR")
Usage
To create a CRediT visualization you need to use the contributor function.
This function takes a single argument, a list, which assigns any of the 14 contributor roles to an individual.
In other words, the name of the list element is the name of the contributor and any numbers included for that individual correspond with 1-14 in the list of roles.
For example...
library("contributoR") # Create example list ex_1 <- list( JVC = 1:13, JGP = 1, NR = c(2, 4)) # Plot contributions contributor(contributions = ex_1)
You can also build the list directly inside the contributor function.
# Build list inside function contributor( contributions = list( "Author 1" = seq(1, 14, by = 3), "Author 2" = c(1, 3, 5, 7, 9, 13), "Lazy person" = NA, "Author 3" = c(2, 4, 8, 14), "Advisor" = 12) )
Experimental
It is also possible to quantify how much one contributes by adding weight to the list. For example:
contributions <- list( p1 = tibble::tibble(role = 1:3, weight = c("low", "med", "high")), p2 = tibble::tibble(role = 3:8, weight = "high"), p3 = tibble::tibble(role = 1:3, weight = "high"), p4 = tibble::tibble(role = 5:12, weight = rep(c("low", "high"), times = 4))) contributor(contributions, weight = T, option = "C", begin = 0.4, end = 0.9)
If weights are included, the plot generates points that differ in color based on the number of weights specified in the list.
By default contributor uses the viridis color palettes for discrete variables, thus it is possible to include arguments like option, begin, and end to customize the point colors.
It is also possible to use the dataframe generated by contributoR to print contributions in prose.
This can be useful if you have a large list of co-authors.
contributions_in_prose <- contributor_df_builder(ex_1) |> contribution_to_text()
Now I can use in-line R code to print contributions_in_prose like this:
The authors made the following contributions: `r contributions_in_prose`
to_print <- contributoR::contributor_df_builder( list( JVC = 1:13, JGP = 1, NR = c(2, 4) ) ) |> contributoR::contribution_to_text()
The authors made the following contributions: r to_print
R Package Documentation
Browse R Packages
We want your feedback!
Note that we can't provide technical support on individual packages. You should contact the package authors for that.
Embedding an R snippet on your website
Add the following code to your website.
For more information on customizing the embed code, read Embedding Snippets.