inst/visu/components/d3-plugins/horizon/README.md
In jwist/visualizeR: visualize metabolomics data interactively
d3.horizon
Demo: http://bl.ocks.org/1483226
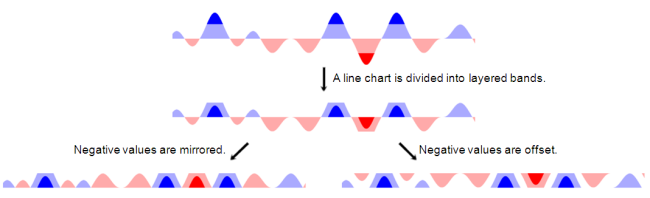
A horizon chart is a variation of a single-series area chart where the area is folded into multiple bands. Color is used to encode bands, allowing the size of the chart to be reduced significantly without impeding readability.
This layout algorithm is based on the work of J. Heer, N. Kong and M. Agrawala in "Sizing the Horizon: The Effects of Chart Size and Layering on the Graphical Perception of Time Series Visualizations", CHI 2009.
http://hci.stanford.edu/publications/2009/heer-horizon-chi09.pdf
jwist/visualizeR documentation built on Dec. 1, 2019, 5:11 p.m.
R Package Documentation
Browse R Packages
We want your feedback!
Note that we can't provide technical support on individual packages. You should contact the package authors for that.
d3.horizon
Demo: http://bl.ocks.org/1483226
A horizon chart is a variation of a single-series area chart where the area is folded into multiple bands. Color is used to encode bands, allowing the size of the chart to be reduced significantly without impeding readability.
This layout algorithm is based on the work of J. Heer, N. Kong and M. Agrawala in "Sizing the Horizon: The Effects of Chart Size and Layering on the Graphical Perception of Time Series Visualizations", CHI 2009.
http://hci.stanford.edu/publications/2009/heer-horizon-chi09.pdf
R Package Documentation
Browse R Packages
We want your feedback!
Note that we can't provide technical support on individual packages. You should contact the package authors for that.
Embedding an R snippet on your website
Add the following code to your website.
For more information on customizing the embed code, read Embedding Snippets.