README.md
In kabiraj404/analyzeJ2Kmodel: Displays the basic information of your J2K model
analyzeJ2Kmodel
This package is for checking some of the basic information while setting up the J2000 hydrological model in any basin. This package provides the basic glimpse of the some basic plots/information of your basin.
Enjoy :)
Install the devtools package
To install a R package from github, start by installing the devtools package. The best way to do this is from CRAN, by typing:
* install.packages("devtools")
Install the package from GitHub
The devtools package provides install_github() that enables installing packages from GitHub. Now, the package of interest, from GitHub, can be installed using the author name and the name of the package. For example in the following example we are installing analzeJ2Kmodel created kabiraj404.
-
library(devtools)
-
install_github("kabiraj404/analyzeJ2Kmodel")
*(Here, kabiraj404 is the author and analyzeJ2Kmodel is the package name )
- library(analyzeJ2Kmodel)
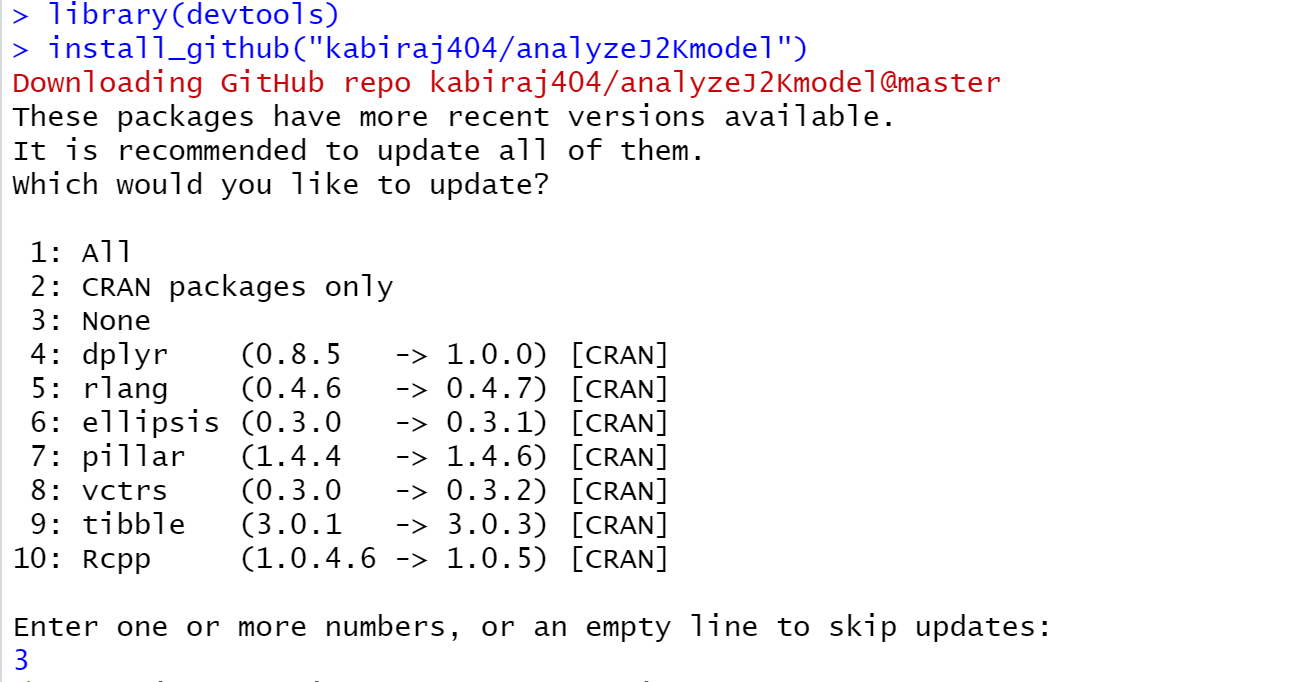
While using R.4.0, the following message might be seen while trying to install the package, Possibly due to the version mismatch, here the newer versions of packages can be skipped (3 in my case).
Install the dependent packages
Once the analyzeJ2Kmodel package is installed on the mashine. It is ready for the further analysis. Before that make sure the required suppliment packages for this package to run are on your mashine.
Currently, the following packages are applied for the different functions used in the package therefore, its better if you copy and paste the following code
if (!require("data.table")) install.packages("data.table")
library(data.table)
if (!require("ggplot2")) install.packages("ggplot2")
library(ggplot2)
if (!require("dplyr")) install.packages("dplyr")
library(dplyr)
if (!require("tidyr")) install.packages("tidyr")
library(tidyr)
if (!require("knitr")) install.packages("knitr")
library(knitr)
if (!require("zoo")) install.packages("zoo")
library(zoo)
if (!require("scales")) install.packages("scales")
library(scales)
Once the required package are in the machine. You are all set to use all the functions of the alayzeJ2Kmodel package.
Here is some glimpse of each functions.
Running the analyzeJ2Kpackage package
Note: You should have workingFolder as the path where your jam file of the model is situated. In my case, I do the following.
(I have also kept the dummy model with limited data inside the repository "SampleData/J2K_model" to check the package).
*workingFolder <- "C:\J2K_model\"
Lets starts with visulizing the input and output of the model. For this purpose use:
- J2K_WatBalMajorComps()
NOTE: There is no need to put anything inside the bracket.
NOTE: You might get the following error:
Error in fread(paste(workingFolder, "output\current\TimeLoop.dat", sep = ""), : could not find function "fread"
This is possible because to read the timeloop.dat file of the model, I have used the fread function from the time.loop package and you might not have installed the dependent packages as requested above . Therefore, I would again suggest you to install all the required dependent package at first. I am not sure whether it is annoying, if it is, I will try to make these package to be installed by default while installing the analyzeJ2Kmodel package.
The major component of the water balance are visualized as below:
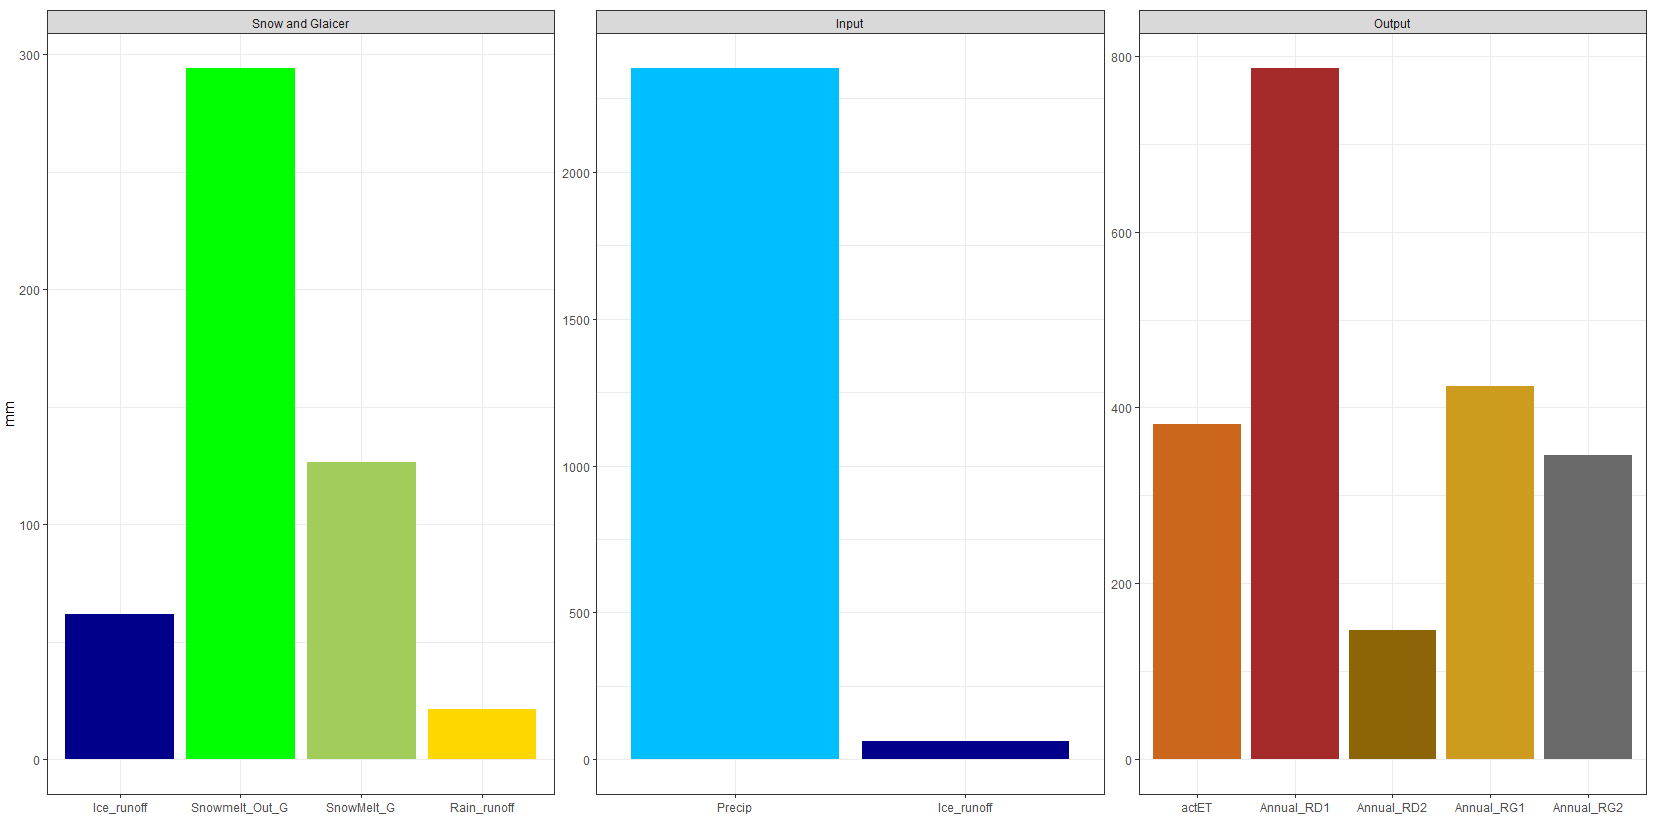
From this figure, we can see the major variables of the input and outpout. Additionally, the snow and glacier component amount are also displayed. All the values are in "mm" unit. It is an important plot for the visulization of the overall information of the basin.
- J2K_inVSoutInfo()
In my example I have get the following result of the input and output.
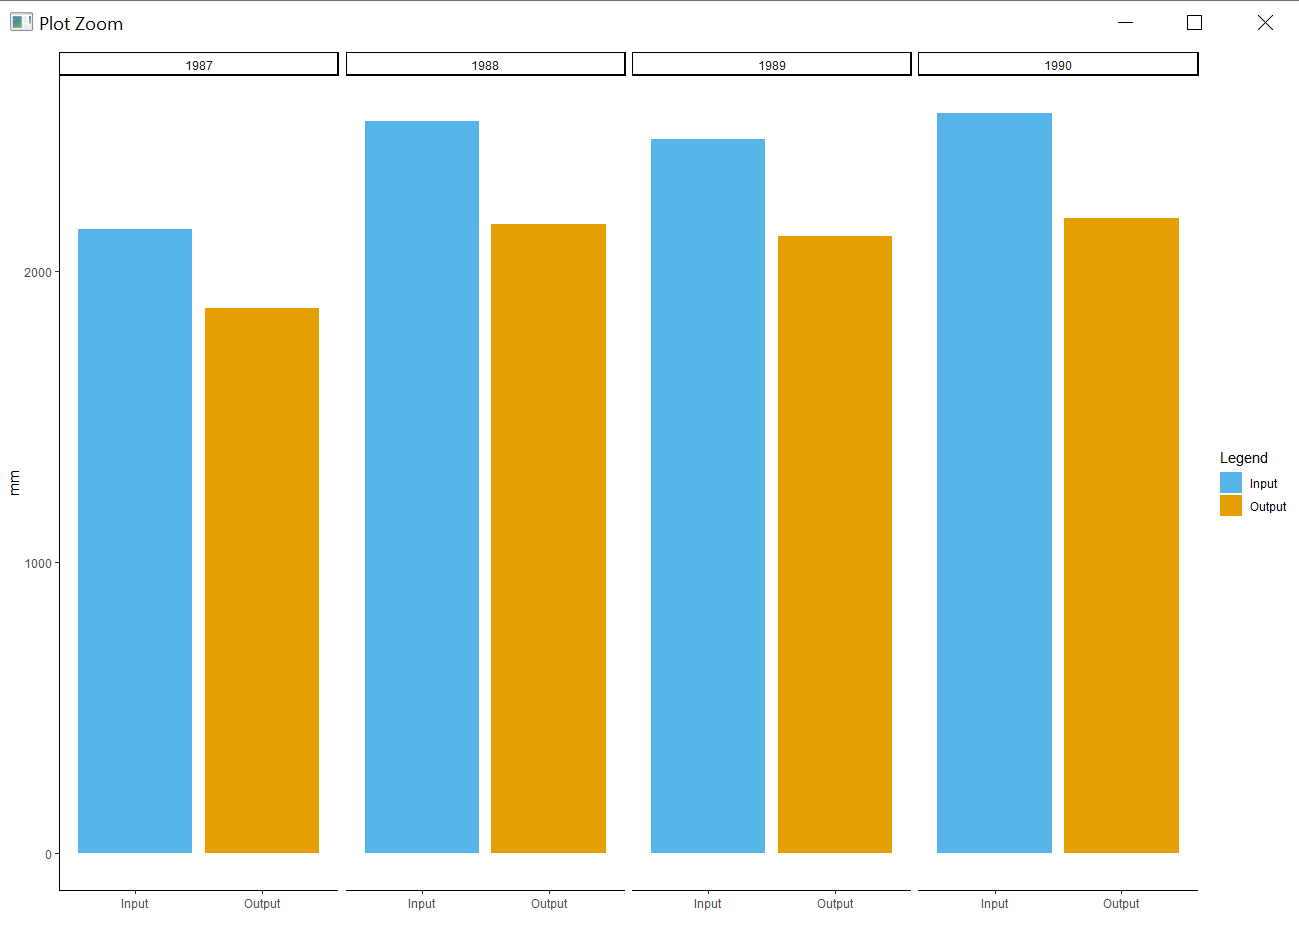 So, we can see that the model has run for the four years. And input and output for each year is shown in the figure. For further understanding of the basin, the daily water balance of the basin can be viewed using the given function.
- J2K_WatBalplot()
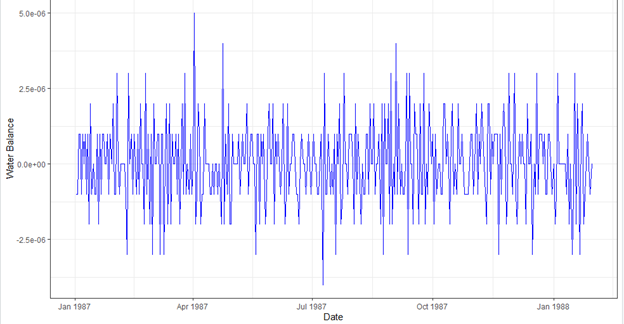 You might not get the exactly this figure but it has to be near to zero.
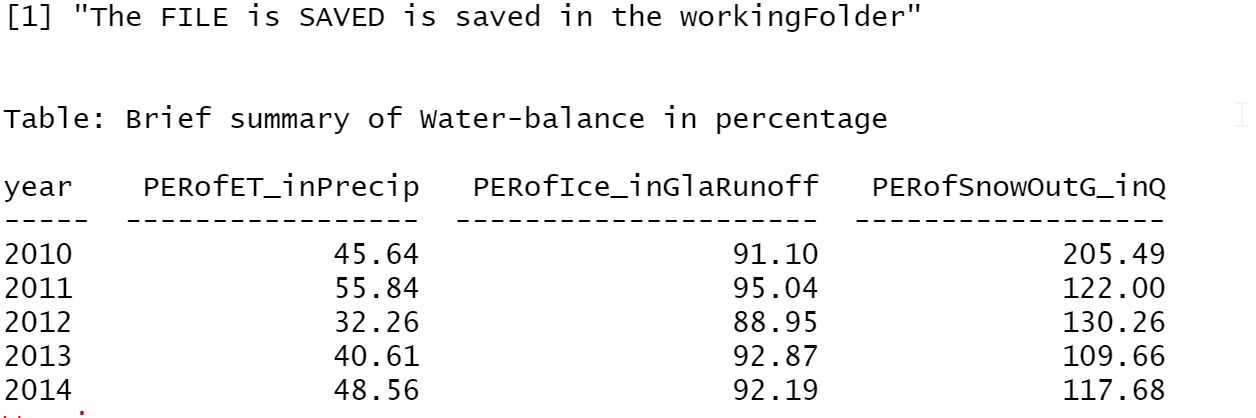
Now, the following function saves the summary data in the working folder in the "csv" format.The quick overview is also displayed in the console. The suppliment information you would get is the percentage of the different variables. For example: yearly percentage of glacier in runoff. percentage of snowrunoff, evapotranspiration etc.
- J2K_WatBalsummarySave()

Now, lets explore some function to explore the snow cover area of the basin/catchment.
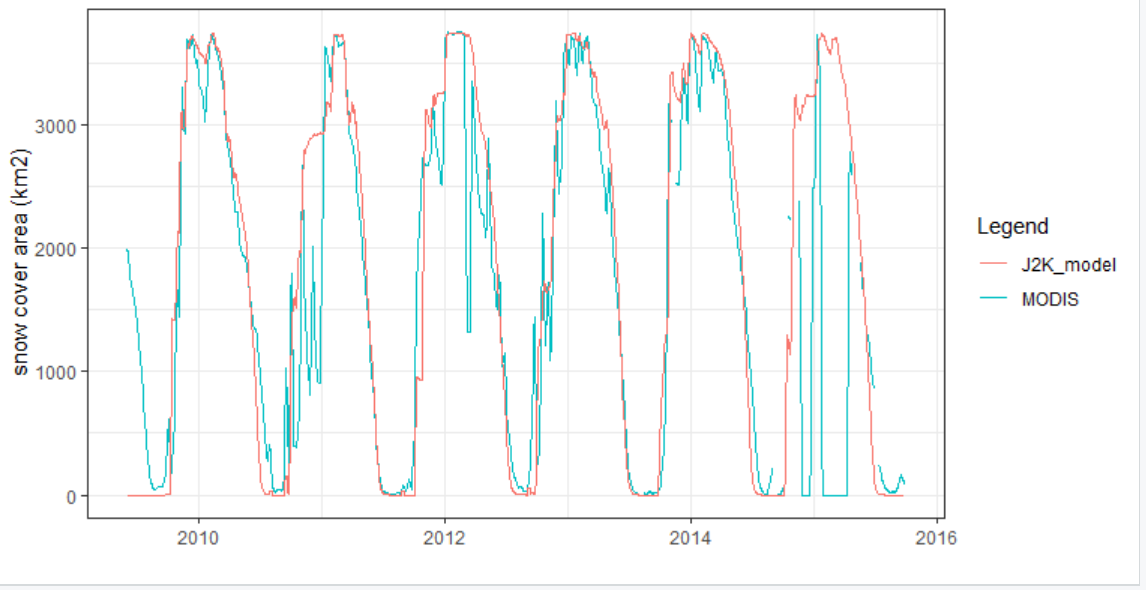
- J2K_snowcoverTS()
It helps in the visulization of the daily snow cover area in each day. It helps to visualize the MODIS and the output from the model at the same instance. The other products can also be used in the model, however it needs some adjustment. I got the following figure.
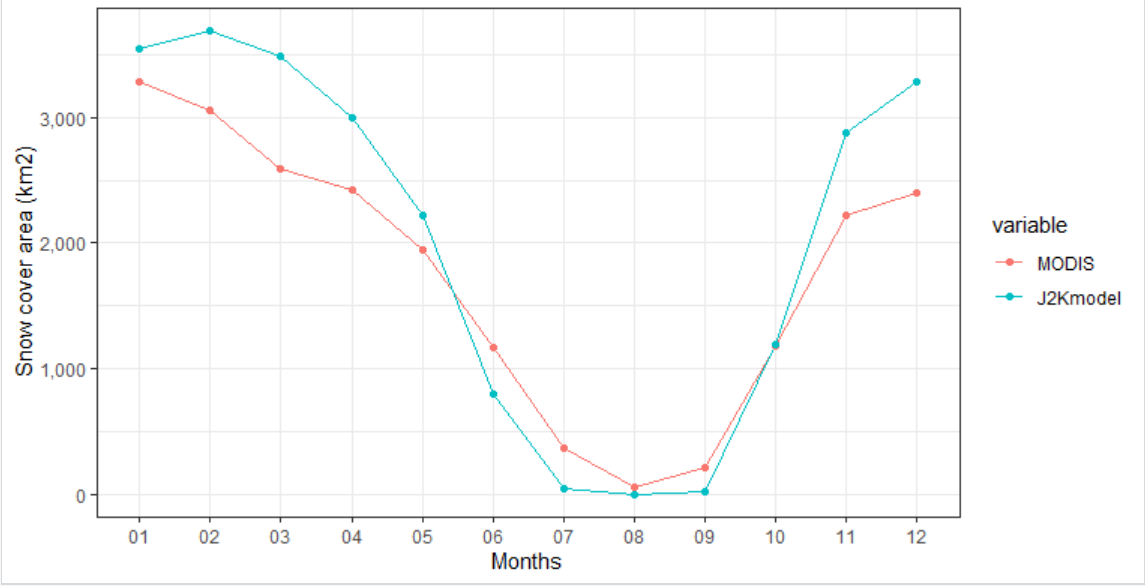
Another way to visualize the snow cover of the area is by viewing the monthly average, for that purpose you can use the following function.
- J2K_MonthMeanSC()
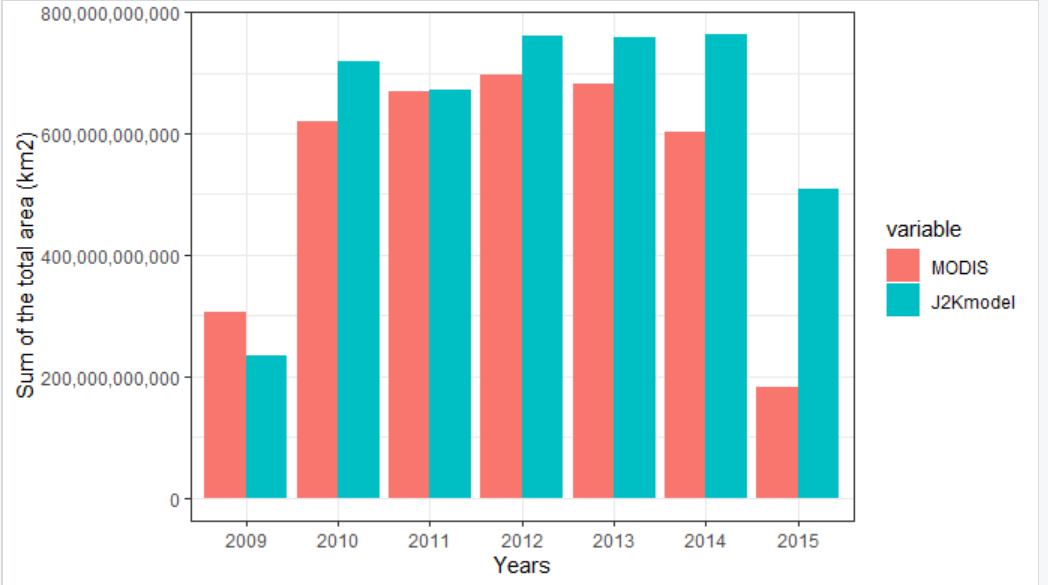
Likewise, to view the snow cover in the annual scale, following function is used.
- J2K_AnnualSumSC()
 It is important to visualize of the precipitation and discharge in the same unit to get the holistic water balance situation of the basin. Following function displays the precipitation and discharge in the same unit "mm",based on your intput data.
- J2K_RainVsRunoffmmMonthly()
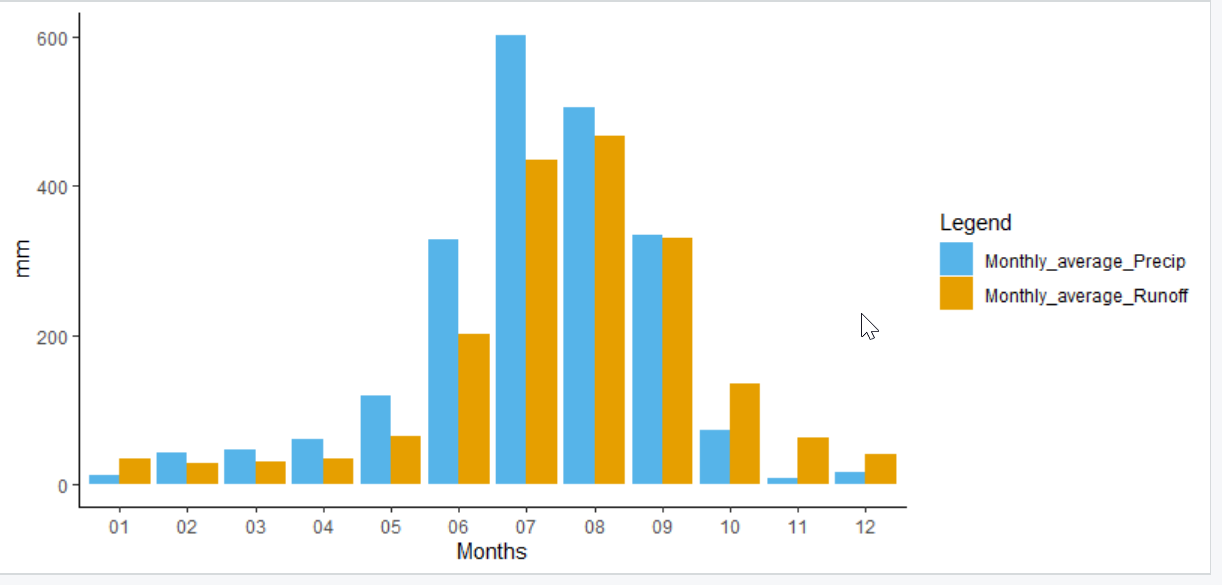
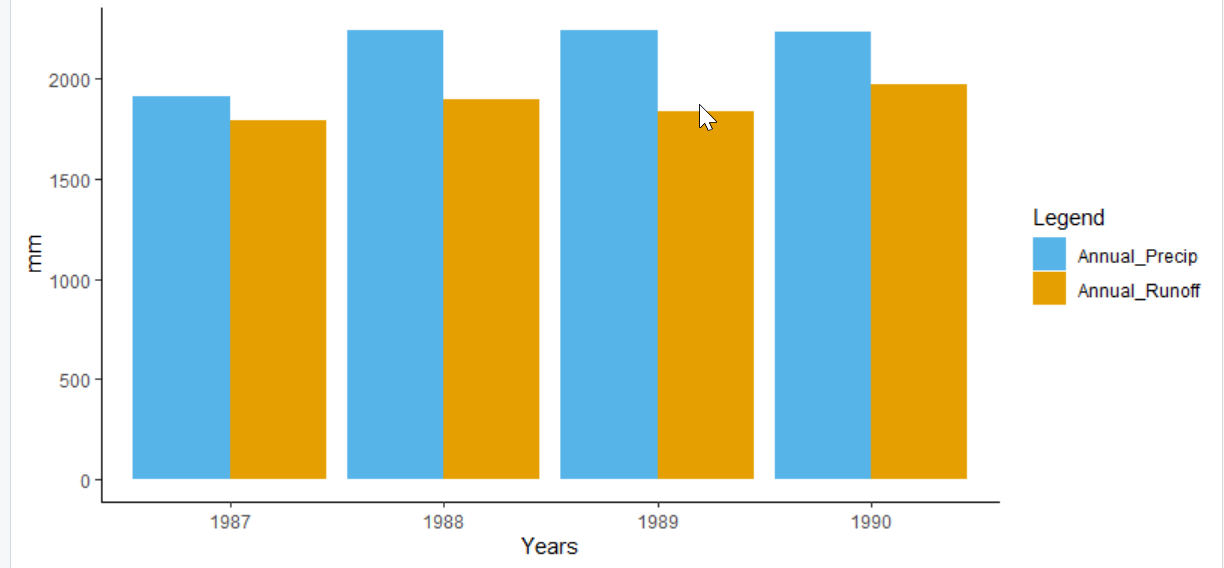
While preparing this plot, the date format is asked, some of the date format are %d.%m.%Y; %Y-%m-%d, you can check your rain.dat, orun.dat or other input data to see the date format in start or end date. Now, lets visulize the annual plots.
- J2K_RainVsRunoffmmYearly()
One important issue while working in the model is the issue where the non-glacier HRUs supply water to the glacier area. for this purpose the non-glacier ID which are doing so are corrected and saved to the working folder.
- J2K_FixmyNG2G()

These are some of the ideas and plots, if have amy more, share your idea.
kabiraj404/analyzeJ2Kmodel documentation built on Aug. 17, 2024, 1:50 a.m.
R Package Documentation
Browse R Packages
We want your feedback!
Note that we can't provide technical support on individual packages. You should contact the package authors for that.
analyzeJ2Kmodel
This package is for checking some of the basic information while setting up the J2000 hydrological model in any basin. This package provides the basic glimpse of the some basic plots/information of your basin. Enjoy :)
Install the devtools package
To install a R package from github, start by installing the devtools package. The best way to do this is from CRAN, by typing: * install.packages("devtools")
Install the package from GitHub
The devtools package provides install_github() that enables installing packages from GitHub. Now, the package of interest, from GitHub, can be installed using the author name and the name of the package. For example in the following example we are installing analzeJ2Kmodel created kabiraj404.
-
library(devtools)
-
install_github("kabiraj404/analyzeJ2Kmodel")
*(Here, kabiraj404 is the author and analyzeJ2Kmodel is the package name )
- library(analyzeJ2Kmodel)
While using R.4.0, the following message might be seen while trying to install the package, Possibly due to the version mismatch, here the newer versions of packages can be skipped (3 in my case).
Install the dependent packages
Once the analyzeJ2Kmodel package is installed on the mashine. It is ready for the further analysis. Before that make sure the required suppliment packages for this package to run are on your mashine. Currently, the following packages are applied for the different functions used in the package therefore, its better if you copy and paste the following code
if (!require("data.table")) install.packages("data.table") library(data.table) if (!require("ggplot2")) install.packages("ggplot2") library(ggplot2) if (!require("dplyr")) install.packages("dplyr") library(dplyr) if (!require("tidyr")) install.packages("tidyr") library(tidyr) if (!require("knitr")) install.packages("knitr") library(knitr) if (!require("zoo")) install.packages("zoo") library(zoo) if (!require("scales")) install.packages("scales") library(scales)
Once the required package are in the machine. You are all set to use all the functions of the alayzeJ2Kmodel package. Here is some glimpse of each functions.
Running the analyzeJ2Kpackage package
Note: You should have workingFolder as the path where your jam file of the model is situated. In my case, I do the following. (I have also kept the dummy model with limited data inside the repository "SampleData/J2K_model" to check the package).
*workingFolder <- "C:\J2K_model\"
Lets starts with visulizing the input and output of the model. For this purpose use:
- J2K_WatBalMajorComps()
NOTE: There is no need to put anything inside the bracket.
NOTE: You might get the following error: Error in fread(paste(workingFolder, "output\current\TimeLoop.dat", sep = ""), : could not find function "fread" This is possible because to read the timeloop.dat file of the model, I have used the fread function from the time.loop package and you might not have installed the dependent packages as requested above . Therefore, I would again suggest you to install all the required dependent package at first. I am not sure whether it is annoying, if it is, I will try to make these package to be installed by default while installing the analyzeJ2Kmodel package.
The major component of the water balance are visualized as below:
From this figure, we can see the major variables of the input and outpout. Additionally, the snow and glacier component amount are also displayed. All the values are in "mm" unit. It is an important plot for the visulization of the overall information of the basin.
- J2K_inVSoutInfo()
In my example I have get the following result of the input and output.
So, we can see that the model has run for the four years. And input and output for each year is shown in the figure. For further understanding of the basin, the daily water balance of the basin can be viewed using the given function.
- J2K_WatBalplot()
You might not get the exactly this figure but it has to be near to zero.
Now, the following function saves the summary data in the working folder in the "csv" format.The quick overview is also displayed in the console. The suppliment information you would get is the percentage of the different variables. For example: yearly percentage of glacier in runoff. percentage of snowrunoff, evapotranspiration etc.
- J2K_WatBalsummarySave()
Now, lets explore some function to explore the snow cover area of the basin/catchment.
- J2K_snowcoverTS()
It helps in the visulization of the daily snow cover area in each day. It helps to visualize the MODIS and the output from the model at the same instance. The other products can also be used in the model, however it needs some adjustment. I got the following figure.
Another way to visualize the snow cover of the area is by viewing the monthly average, for that purpose you can use the following function.
- J2K_MonthMeanSC()
Likewise, to view the snow cover in the annual scale, following function is used.
- J2K_AnnualSumSC()
It is important to visualize of the precipitation and discharge in the same unit to get the holistic water balance situation of the basin. Following function displays the precipitation and discharge in the same unit "mm",based on your intput data.
- J2K_RainVsRunoffmmMonthly()
While preparing this plot, the date format is asked, some of the date format are %d.%m.%Y; %Y-%m-%d, you can check your rain.dat, orun.dat or other input data to see the date format in start or end date. Now, lets visulize the annual plots.
- J2K_RainVsRunoffmmYearly()
One important issue while working in the model is the issue where the non-glacier HRUs supply water to the glacier area. for this purpose the non-glacier ID which are doing so are corrected and saved to the working folder.
- J2K_FixmyNG2G()
These are some of the ideas and plots, if have amy more, share your idea.
R Package Documentation
Browse R Packages
We want your feedback!
Note that we can't provide technical support on individual packages. You should contact the package authors for that.
Embedding an R snippet on your website
Add the following code to your website.
For more information on customizing the embed code, read Embedding Snippets.