README.md
In low-decarie/temperatureresponse: Temperature Response

temperatureresponse

R package for fitting a suite equations for the unimodal response to temperature
Install from CRAN:
install.packages("temperatureresponse")
Install from github:
require(devtools)
install_github("low-decarie/temperatureresponse")
Companion to:
Low-Décarie E, Boatman TG, Bennett N, Passfield W, Gavalás-Olea A, Siegel P, Geider RJ (2017) Predictions of response to temperature are contingent on model choice and data quality. Ecology and Evolution, 1–15.
http://dx.doi.org/10.1002/ece3.3576
Caption from publication
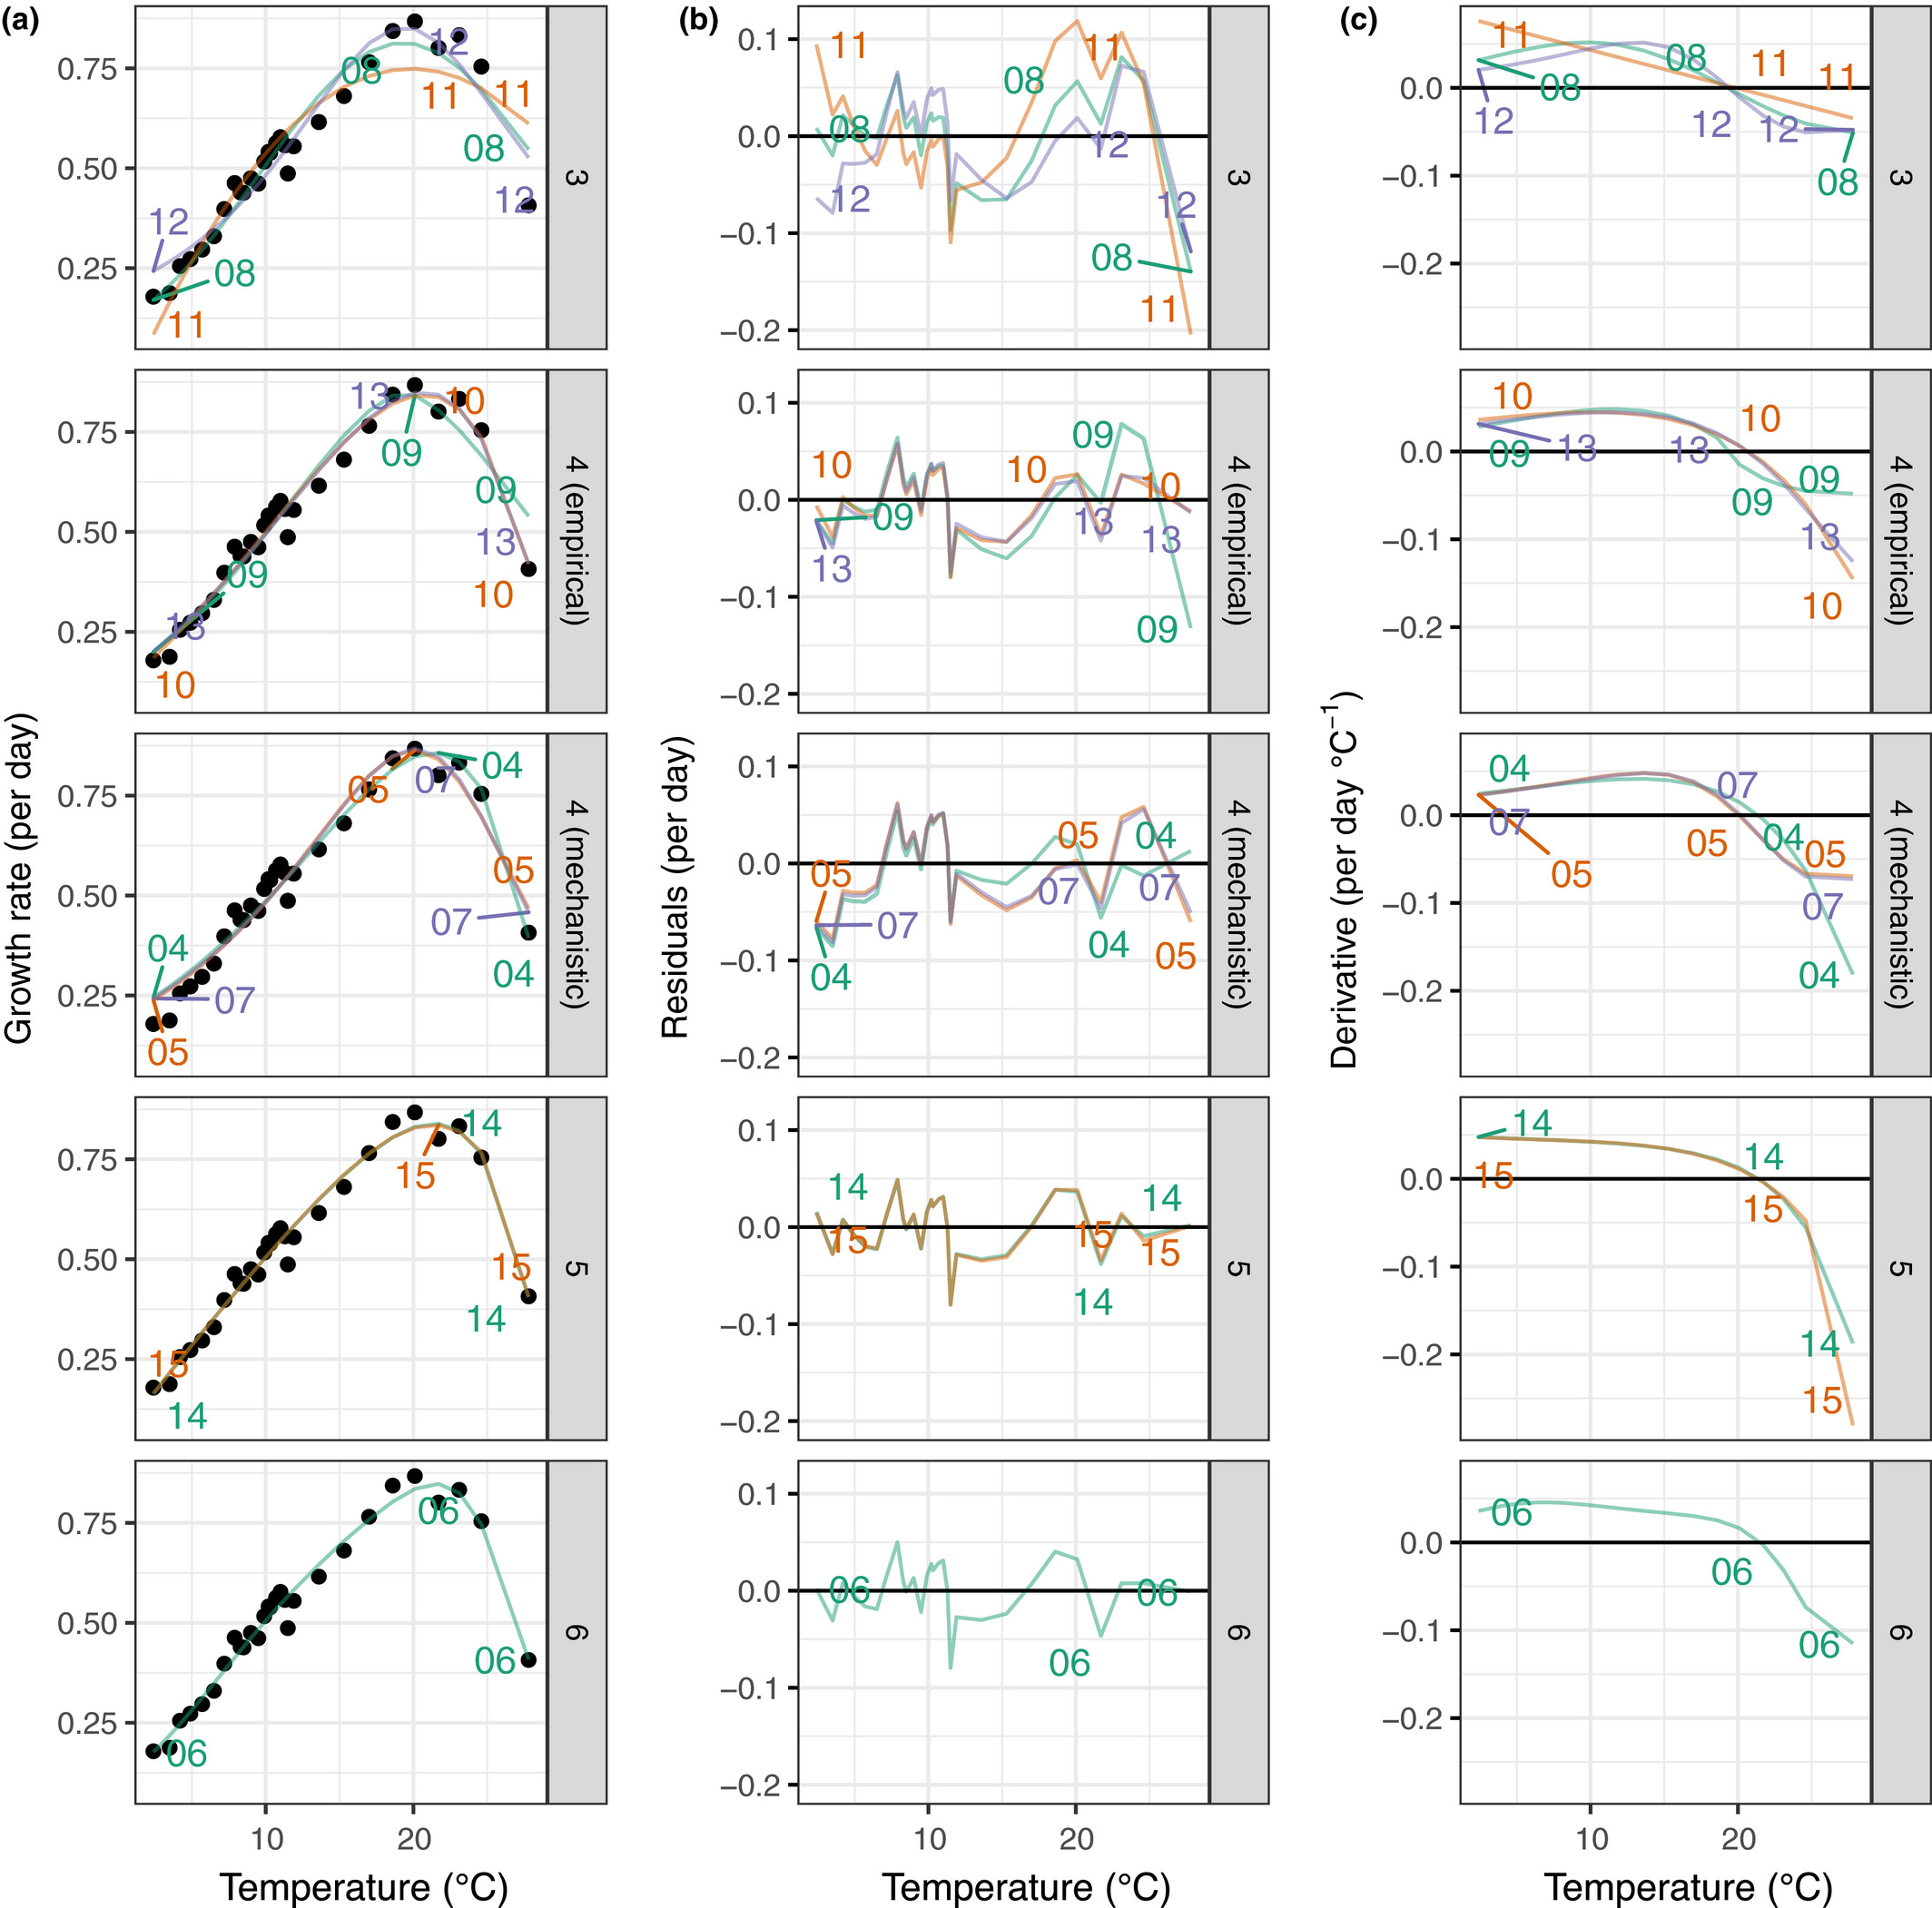
Figure 3 (a) Equation fit to an example dataset of phytoplankton growth rate as a function of temperature (Phaeodactylum tricornutum). The points are the measured growth rate (same values across panels), and the lines are the equation predicted growth rates. (b) Equation residuals as function of temperature. (c) Value of the first derivative (gradient) at each measured temperature. Numbers within the figure indicate the equation number. Equations are grouped as a function of their number of parameters (3–6). Equations with four parameters are further divided between empirical and mechanistic equations to minimize clutter within the plots. Lines for individual equations are labeled with color and the equation number. Similar patterns can be observed for other species
low-decarie/temperatureresponse documentation built on May 29, 2019, 11:40 a.m.
R Package Documentation
Browse R Packages
We want your feedback!
Note that we can't provide technical support on individual packages. You should contact the package authors for that.
temperatureresponse
R package for fitting a suite equations for the unimodal response to temperature
Install from CRAN:
install.packages("temperatureresponse")
Install from github:
require(devtools)
install_github("low-decarie/temperatureresponse")
Companion to: Low-Décarie E, Boatman TG, Bennett N, Passfield W, Gavalás-Olea A, Siegel P, Geider RJ (2017) Predictions of response to temperature are contingent on model choice and data quality. Ecology and Evolution, 1–15. http://dx.doi.org/10.1002/ece3.3576
Caption from publication
Figure 3 (a) Equation fit to an example dataset of phytoplankton growth rate as a function of temperature (Phaeodactylum tricornutum). The points are the measured growth rate (same values across panels), and the lines are the equation predicted growth rates. (b) Equation residuals as function of temperature. (c) Value of the first derivative (gradient) at each measured temperature. Numbers within the figure indicate the equation number. Equations are grouped as a function of their number of parameters (3–6). Equations with four parameters are further divided between empirical and mechanistic equations to minimize clutter within the plots. Lines for individual equations are labeled with color and the equation number. Similar patterns can be observed for other species
R Package Documentation
Browse R Packages
We want your feedback!
Note that we can't provide technical support on individual packages. You should contact the package authors for that.
Embedding an R snippet on your website
Add the following code to your website.
For more information on customizing the embed code, read Embedding Snippets.