In lucidviews/repvisForODK: Analyse data from ODK Central
knitr::opts_chunk$set(
  collapse = TRUE,
  comment = "#>"
)
The integrated web app consists of three different sections The user has to go through all of them one after another in order to obtain the final output - a downloadable html report. To launch the app locally on your machine, the function run_app() can be used. Shiny apps when launched through RStudio are by default also run in RStudio. It is, however, recommendable to run them in browser by pressing the "Open in Browser" button because only then all images are displayed correctly.
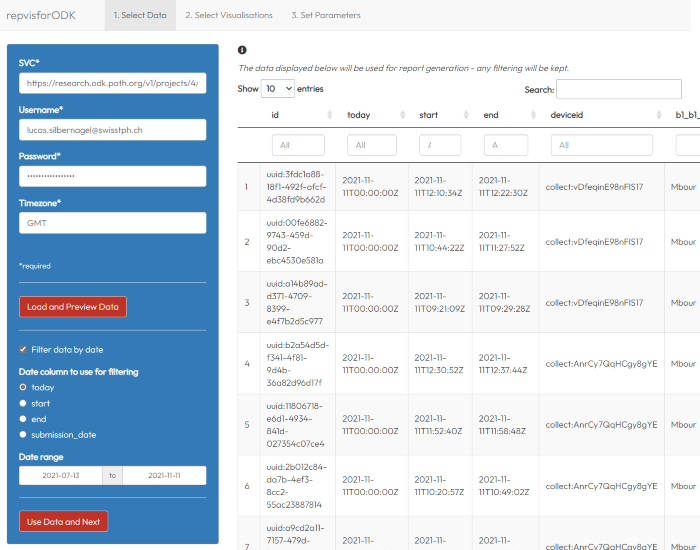
- Select Data\
In this section, the data which is used for the report generation is defined.
Firstly, one needs to provide ODK Central log in credentials (username and password), the time zone in which the data was collected, and an svc link. The latter can be accessed by clicking on the "Analyze via OData..." button on the the respective from on ODK Central. The actual download of the data is then triggered by clicking the "Load and Preview Data" button in the app. When the data download is successfully completed, the data is displayed in the main panel.\
Secondly, one now has two ways of filtering the data. To apply a date filter, the corresponding check box on the sidebar has to clicked. This will trigger more input options. The app automatically shows all date/time stamp columns in the data out of which needs to be chosen. After that, the date range needs to defined (selected start and end dates are inclusive). The changes made will be directly be reflected in the data preview. Additional filtering can be done using the text inputs above each column of the previewed data.\
Always keep in mind that the previewed data is the one used to generate the report. You can play around with all filtering options until the data is in its desired state.\
Proceed by clicking on the "Use Data and Next" button.
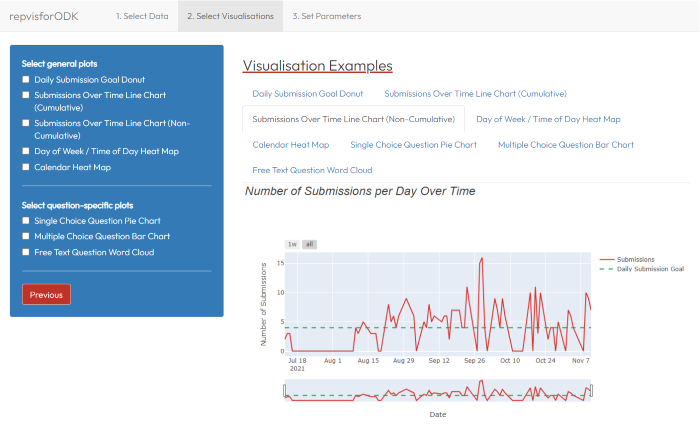
- Select Visualisations\
In this section, one or more of the 7 visualizations can be selected. To do so, one must tick the respective box in the sidebar. As soon as one of the plots has been selected, a "Next" button appears which will take you to the last tab.\
To get an idea of how the visualizations that are offered look like, there is an exemplary image for each of them available in the main panel. To access, just click on the respective name.
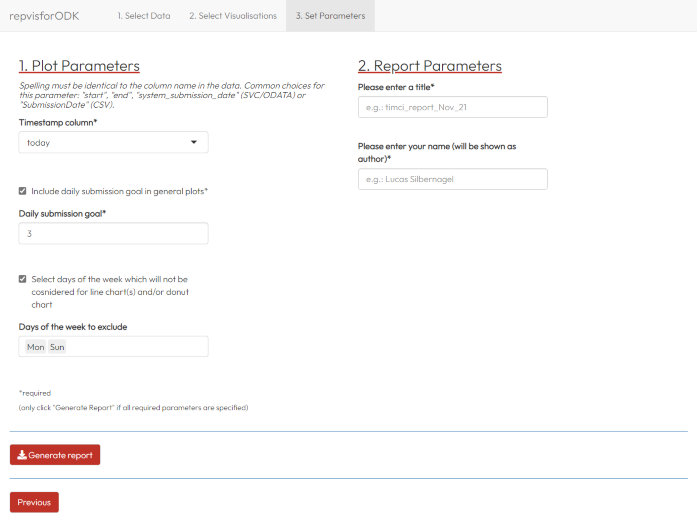
- Set Parameters\
In the final section, one must define the parameters necessary to create the report with the visualizations selected.\
Depending on the latter, the set of parameters that need to be defined, can differ. Generally, the app differentiates between plot and report parameters where the former is on the left and the latter on the right hand side of the app. The report parameters are independent from the selected visualizations and have to be defined regardless. All parameters marked with a "*" are required while all others optional.\
After at least all required parameters have been filled defined, the report can now be generated by clicking the "Generate Report" button. If the app is used in browser, the generated html file will be automatically stored in the download folder in the file explorer. If the app is run through RStudio, a file explorer window will pop up and one can choose the storage location themselves.
lucidviews/repvisForODK documentation built on Feb. 13, 2022, 9:50 p.m.
R Package Documentation
Browse R Packages
We want your feedback!
Note that we can't provide technical support on individual packages. You should contact the package authors for that.
knitr::opts_chunk$set( collapse = TRUE, comment = "#>" )
The integrated web app consists of three different sections The user has to go through all of them one after another in order to obtain the final output - a downloadable html report. To launch the app locally on your machine, the function run_app() can be used. Shiny apps when launched through RStudio are by default also run in RStudio. It is, however, recommendable to run them in browser by pressing the "Open in Browser" button because only then all images are displayed correctly.
- Select Data\ In this section, the data which is used for the report generation is defined. Firstly, one needs to provide ODK Central log in credentials (username and password), the time zone in which the data was collected, and an svc link. The latter can be accessed by clicking on the "Analyze via OData..." button on the the respective from on ODK Central. The actual download of the data is then triggered by clicking the "Load and Preview Data" button in the app. When the data download is successfully completed, the data is displayed in the main panel.\ Secondly, one now has two ways of filtering the data. To apply a date filter, the corresponding check box on the sidebar has to clicked. This will trigger more input options. The app automatically shows all date/time stamp columns in the data out of which needs to be chosen. After that, the date range needs to defined (selected start and end dates are inclusive). The changes made will be directly be reflected in the data preview. Additional filtering can be done using the text inputs above each column of the previewed data.\ Always keep in mind that the previewed data is the one used to generate the report. You can play around with all filtering options until the data is in its desired state.\ Proceed by clicking on the "Use Data and Next" button.
- Select Visualisations\ In this section, one or more of the 7 visualizations can be selected. To do so, one must tick the respective box in the sidebar. As soon as one of the plots has been selected, a "Next" button appears which will take you to the last tab.\ To get an idea of how the visualizations that are offered look like, there is an exemplary image for each of them available in the main panel. To access, just click on the respective name.
- Set Parameters\ In the final section, one must define the parameters necessary to create the report with the visualizations selected.\ Depending on the latter, the set of parameters that need to be defined, can differ. Generally, the app differentiates between plot and report parameters where the former is on the left and the latter on the right hand side of the app. The report parameters are independent from the selected visualizations and have to be defined regardless. All parameters marked with a "*" are required while all others optional.\ After at least all required parameters have been filled defined, the report can now be generated by clicking the "Generate Report" button. If the app is used in browser, the generated html file will be automatically stored in the download folder in the file explorer. If the app is run through RStudio, a file explorer window will pop up and one can choose the storage location themselves.
R Package Documentation
Browse R Packages
We want your feedback!
Note that we can't provide technical support on individual packages. You should contact the package authors for that.
Embedding an R snippet on your website
Add the following code to your website.
For more information on customizing the embed code, read Embedding Snippets.