README.md
In luluperet/icor: What the Package Does (One Line, Title Case)
ICOR, Correlation and Usefull Functions, Operators and Classes
EXAMPLES
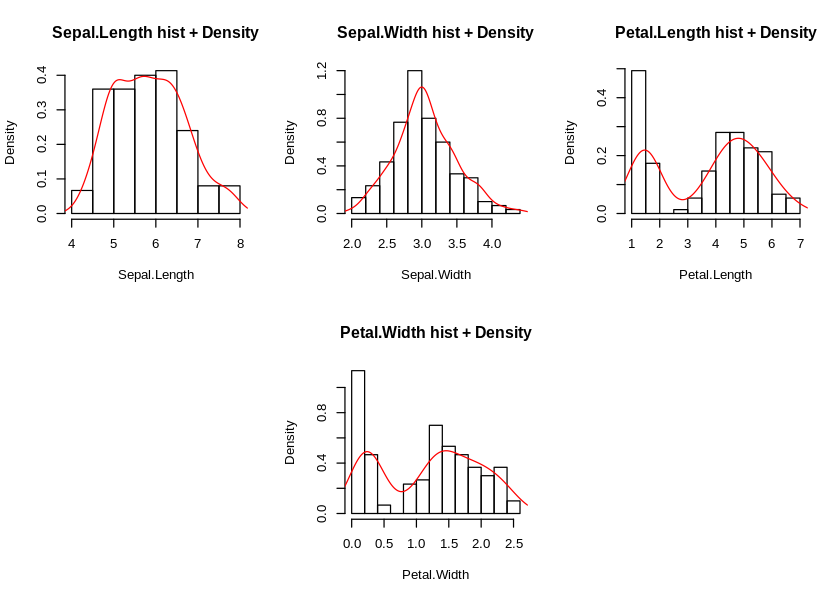
iris %>%
    numericCol %getCol%
                 1:4    %>skip>% {
                            layout_build_matrix(
                                  1,2,3|
                                  0,4,0
                            );
                            resetPlt = plotWH(7,5)
                        }%each% l__(
                            {
                                name=names(dimnames(.))
                                hist(.x,xlab = name,main = name%.%" hist + Density",probability = T);
                                densityLines(.x,col="red")
                            }
                                ) %>% invisible
#SAME
#We use eachCol instead of each (.y is the colname)
#We use tg instead of invisible (same, but remove warnings too)

iris %>%
    numericCol %getCol%
                 1:4    %>skip>% {
                            layout_build_matrix(
                                  1,2,3|
                                  0,4,0
                            );
                            resetPlt = plotWH(7,5)
                        } %eachCol% l1__(
                            {
                                name=.y
                                hist(.x,xlab = name,main = name%.%" hist + Density",probability = T);
                                densityLines(.x,col="red")
                            }
                                ) %>% tg
EQ
Test values each in vector
< <= == >= >
%||%
```R
c(4,2,1) %||% c(9,4,0) < 3
[1] FALSE
**%|%**</br>R
c(4,2,1) %|% c(9,4,0) < 3
[1] FALSE TRUE TRUE
**%&&%** </br>R
c(4,2,1) %&&% c(9,4,0) < 3
[1] FALSE
**%&%**</br>R
c(4,2,1) %&% c(9,4,0) < 3
[1] FALSE FALSE TRUE
```
list To Parameters of a Function
Call function of the right side, with elements of the list passed in the left side
Operators
%...>%(#list|#atomic,#function) (keep names)
```R
list(mean=10,n=5,sd = 2) %...>% rnorm
[1] 12.817348 10.284119 11.355081 7.372176 7.795275
list(mean=10,n=5,sd = 2) %...>% smth
List of 3
$ mean: num 10
$ n : num 5
$ sd : num 2
10 %,% 20 %...>% rnorm
[1] 19.51830 19.32193 17.89852 20.27248 19.79469 22.44875 21.06525 22.81541 20.42578
[10] 20.35683
(see #icor_lists below)
10 %...>% rnorm
[1] 0.88250520 -1.06436486 0.44685920 -0.58315920 1.05593594 0.28902886 -0.01550811
[8] 0.76758399 2.07238604 -0.86256077
**%..._>%(#list|#atomic,#function) (not keep names)**R
list(mean=10,n=5,sd = 2) %..._>% rnorm
[1] 4.5024198 8.4893204 10.0372266 4.5468650 3.7732437 4.1219222
[7] 3.7688349 0.1318678 0.9097222 7.8097455
list(mean=10,n=5,sd = 2) %..._>% smth
List of 3
$ : num 10
$ : num 5
$ : num 2
10 %,% 20 %...>% rnorm
[1] 20.33436 19.57912 19.15201 18.57136 19.53694 19.09004 18.62865 19.14920 19.08933
[10] 19.00091
#(see #icor_lists below)
10 %..._>% rnorm
[1] 0.88250520 -1.06436486 0.44685920 -0.58315920 1.05593594 0.28902886 -0.01550811
[8] 0.76758399 2.07238604 -0.86256077
**%listToDotsFn%(#list,#function) (keep names)**R
list(mean=10,n=5,sd = 2) %listToDotsFn% rnorm
[1] 11.396479 10.744122 8.012919 11.297808 12.601390
list(ind="a",day=3,month=4) %listToDotsFn% smth
List of 3
$ ind : chr "a"
$ day : num 3
$ month: num 4
**%listToDotsFn_%(#list,#function) (not keep names)**
 *(see "smth" below)*</br>
R
list(ind="a",day=3,month=4) %listToDotsFn_% smth
List of 3
$ : chr "a"
$ : num 3
$ : num 4
10 %,% 20 %listToDotsFn_% rnorm
[1] 20.33436 19.57912 19.15201 18.57136 19.53694 19.09004 18.62865 19.14920 19.08933
[10] 19.00091
(see #icor_lists below)
```
String Concat
%.=%
Concat and assign Strings
> a="Hello "
> a %.=% "World"
> cat(a)
Hello World
%.%
Concat strings (paste0)
```R
"ll"%.%"kk"%.%"kkd"
[1] "llkkkkd"
```
Usefull Utils
curry(fn)
(Currying)[https://en.wikipedia.org/wiki/Currying]
```R
a=curry(rnorm(10))
a
function (...)
rnorm(10, ...)
a(10)
[1] 9.822035 9.897887 10.289826 9.588149 9.705572 11.554598
[7] 11.485561 8.851399 12.550492 10.740860
**smth**</br>
 *Return str of list of dots* w/br>
R
3 %,% 4 %,% l(d=3) %->% smth
List of 3
$ : num 3
$ : num 4
$ :List of 1
..$ d: num 3
smth(1,2,3,4,5,"kkk",rnorm,l1___(rnorm(10)))
List of 8
$ : num 1
$ : num 2
$ : num 3
$ : num 4
$ : num 5
$ : chr "kkk"
$ :function (n, mean = 0, sd = 1)
$ :function (...)
..- attr(, "class")= chr [1:2] "purrr_function_partial" "function"
..- attr(, "body")= language ~(function (n, mean = 0, sd = 1) .Call(C_rnorm, n, mean, sd))(10, ...)
.. ..- attr(, ".Environment")=
..- attr(, "fn")= symbol rnorm
**startsWithFromList(list,string)**</br>
 *filter list with element who begin with string*</br>
R
c("hello","he lo","hehe","bonjour","au revoir") %>% startsWithFromList("he")
[1] "hello" "he lo" "hehe"
**addNamesToList(list,names)**</br>
 *add names to list*</br>
R
c("hello","he lo","hehe","bonjour","au revoir") %>% addNamesToList(1:5)
1 2 3 4 5
"hello" "he lo" "hehe" "bonjour" "au revoir"
c("hello","he lo","hehe","bonjour","au revoir") %>% addNamesToList(1:5 %each% {"d"%.%.})
d1 d2 d3 d4 d5
"hello" "he lo" "hehe" "bonjour" "au revoir"
l("hello","he lo","hehe","bonjour","au revoir") %>% addNamesToList(1:5 %each% {"d"%.%.})
$d1
[1] "hello"
$d2
[1] "he lo"
$d3
[1] "hehe"
$d4
[1] "bonjour"
$d5
[1] "au revoir"
```
nothing(...)
return nothing with whatever params
%call%(#fn,#list)
*call fn with elements of list as parameters
%>skip>%(data,#fn) doAndSkip %-|skip|->%
Execute fn and return data ! all above do the same
Usefull DataFrame
toDF(list) toDFt(list)
convert an list to a dataframe with good colnames, rownames
```R
l("hello","he lo","hehe","bonjour","au revoir") %>% addNamesToList(1:5 %each% {"d"%.%.}) %>% toDF
[,1]
d1 "hello"
d2 "he lo"
d3 "hehe"
d4 "bonjour"
d5 "au revoir"
l("hello","he lo","hehe","bonjour","au revoir") %>% addNamesToList(1:5 %each% {"d"%.%.}) %>% toDFt
d1 d2 d3 d4 d5
1 hello he lo hehe bonjour au revoir
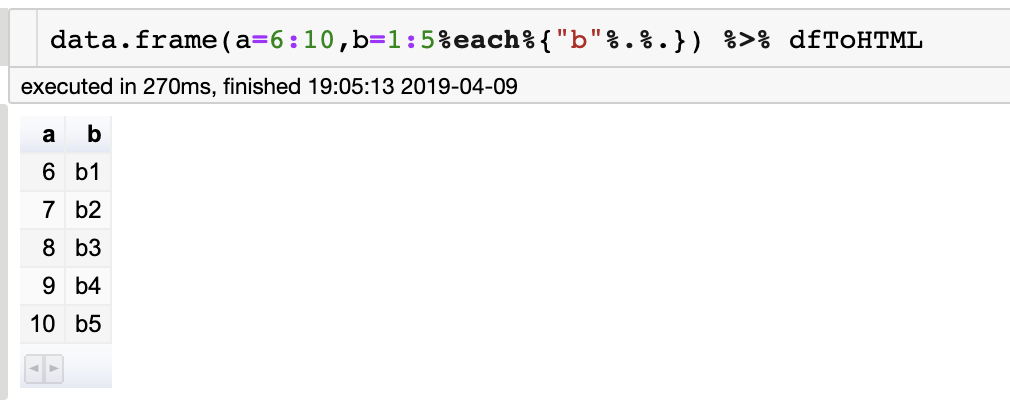
**add_row_with_name(#data.frame)**</br>
 *add row with rowname in a data frame*</br>
R
data.frame(a=6:10,b=1:5%each%{"b"%.%.})
a b
1 6 b1
2 7 b2
3 8 b3
4 9 b4
5 10 b5
data.frame(a=6:10,b=1:5%each%{"b"%.%.}) %>% add_row_with_name(a=9,b="b5",name="9")
a b
1 6 b1
2 7 b2
3 8 b3
4 9 b4
5 10 b5
9 9 b5
**dfRowToList**</br>
 *convert row of data frame to list*</br>
R
data.frame(a=6:10,b=1:5%each%{"b"%.%.}) %>% dfRowToList
$V1
a b
6 b1
Levels: 6 b1
$V2
a b
7 b2
Levels: 7 b2
$V3
a b
8 b3
Levels: 8 b3
$V4
a b
9 b4
Levels: 9 b4
$V5
a b
10 b5
Levels: 10 b5
**dfToHTML(#data.frame)**</br>
*show an data frame in html (only in jupyter notebook)*</br>
# Aleatoire</br>
Aleatoire</br>
# Categorical</br>
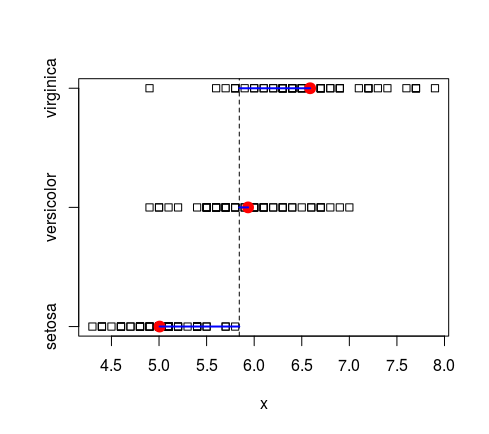
**corrCatCon(#vector,#vector)**</br>
*graph of the values in the first params for each cat in the second parameters*</br>R
iris$Sepal.Length %,% iris$Species %...>% graphCatCon
#SAME AS graphCatCon(iris$Sepal.Length,iris$Species)
#SAME AS iris %$% graphCatCon(Sepal.Length,Species)
```
%by%
create list with as name differents categories and as value, the value associate with this value
```R
iris$Sepal.Length %by% iris$Species
$setosa
[1] 5.1 4.9 4.7 4.6 5.0 5.4 4.6 5.0 4.4 4.9 5.4 4.8 4.8 4.3 5.8 5.7 5.4 5.1 5.7 5.1 5.4
[22] 5.1 4.6 5.1 4.8 5.0 5.0 5.2 5.2 4.7 4.8 5.4 5.2 5.5 4.9 5.0 5.5 4.9 4.4 5.1 5.0 4.5
[43] 4.4 5.0 5.1 4.8 5.1 4.6 5.3 5.0
$versicolor
[1] 7.0 6.4 6.9 5.5 6.5 5.7 6.3 4.9 6.6 5.2 5.0 5.9 6.0 6.1 5.6 6.7 5.6 5.8 6.2 5.6 5.9
[22] 6.1 6.3 6.1 6.4 6.6 6.8 6.7 6.0 5.7 5.5 5.5 5.8 6.0 5.4 6.0 6.7 6.3 5.6 5.5 5.5 6.1
[43] 5.8 5.0 5.6 5.7 5.7 6.2 5.1 5.7
$virginica
[1] 6.3 5.8 7.1 6.3 6.5 7.6 4.9 7.3 6.7 7.2 6.5 6.4 6.8 5.7 5.8 6.4 6.5 7.7 7.7 6.0 6.9
[22] 5.6 7.7 6.3 6.7 7.2 6.2 6.1 6.4 7.2 7.4 7.9 6.4 6.3 6.1 7.7 6.3 6.4 6.0 6.9 6.7 6.9
[43] 5.8 6.8 6.7 6.7 6.3 6.5 6.2 5.9
**%byGraph**</br>
 *same as %by% but plot graph(see corrCatCon) of values for differents cat (only works if the right arguments is a vector)*</br>
R
iris$Sepal.Length %byGraph% iris$Species
$setosa
[1] 5.1 4.9 4.7 4.6 5.0 5.4 4.6 5.0 4.4 4.9 5.4 4.8 4.8 4.3 5.8 5.7 5.4 5.1 5.7 5.1 5.4
[22] 5.1 4.6 5.1 4.8 5.0 5.0 5.2 5.2 4.7 4.8 5.4 5.2 5.5 4.9 5.0 5.5 4.9 4.4 5.1 5.0 4.5
[43] 4.4 5.0 5.1 4.8 5.1 4.6 5.3 5.0
$versicolor
[1] 7.0 6.4 6.9 5.5 6.5 5.7 6.3 4.9 6.6 5.2 5.0 5.9 6.0 6.1 5.6 6.7 5.6 5.8 6.2 5.6 5.9
[22] 6.1 6.3 6.1 6.4 6.6 6.8 6.7 6.0 5.7 5.5 5.5 5.8 6.0 5.4 6.0 6.7 6.3 5.6 5.5 5.5 6.1
[43] 5.8 5.0 5.6 5.7 5.7 6.2 5.1 5.7
$virginica
[1] 6.3 5.8 7.1 6.3 6.5 7.6 4.9 7.3 6.7 7.2 6.5 6.4 6.8 5.7 5.8 6.4 6.5 7.7 7.7 6.0 6.9
[22] 5.6 7.7 6.3 6.7 7.2 6.2 6.1 6.4 7.2 7.4 7.9 6.4 6.3 6.1 7.7 6.3 6.4 6.0 6.9 6.7 6.9
[43] 5.8 6.8 6.7 6.7 6.3 6.5 6.2 5.9

**int.hist**</br>
# Usefull Utils</br>
## capture</br>
**captureCat**</br>
*capture in a variable the result of the cat function for the given parameter*</br>R
a=1:5
a
[1] 1 2 3 4 5
az=captureCat(a)
az
[1] "1 2 3 4 5"
*capturePrint*</br>
 *capture in a variable the result of the cat function for the given parameter*</br>
R
a=lm(Petal.Width ~ Sepal.Length,data=iris)
print(a)
Call:
lm(formula = Petal.Width ~ Sepal.Length, data = iris)
Coefficients:
(Intercept) Sepal.Length
-3.2002 0.7529
az=capturePrint(a)
az
[1] ""
[2] "Call:"
[3] "lm(formula = Petal.Width ~ Sepal.Length, data = iris)"
[4] ""
[5] "Coefficients:"
[6] " (Intercept) Sepal.Length "
[7] " -3.2002 0.7529 "
[8] ""
## embed</br>
 **embed**(x, height="100%",width="100%") </br>
 *Display widget x, in html in jupyter notebook*</br>
 *(see DT::datatable)*</br></br>
R
graph=dataSim %>% ggplot(aes(x=time,y=bin1)) + geom_point() + geom_point_interactive(aes(data_id=rownames(dataSim)), size = 2) + theme_minimal()
graphWidget= graph %>% girafe(ggobj = .) %>% girafe_options(opts_hover(css = "fill:red;r:4pt;"))
embed(graphWidget,"500px","70%")
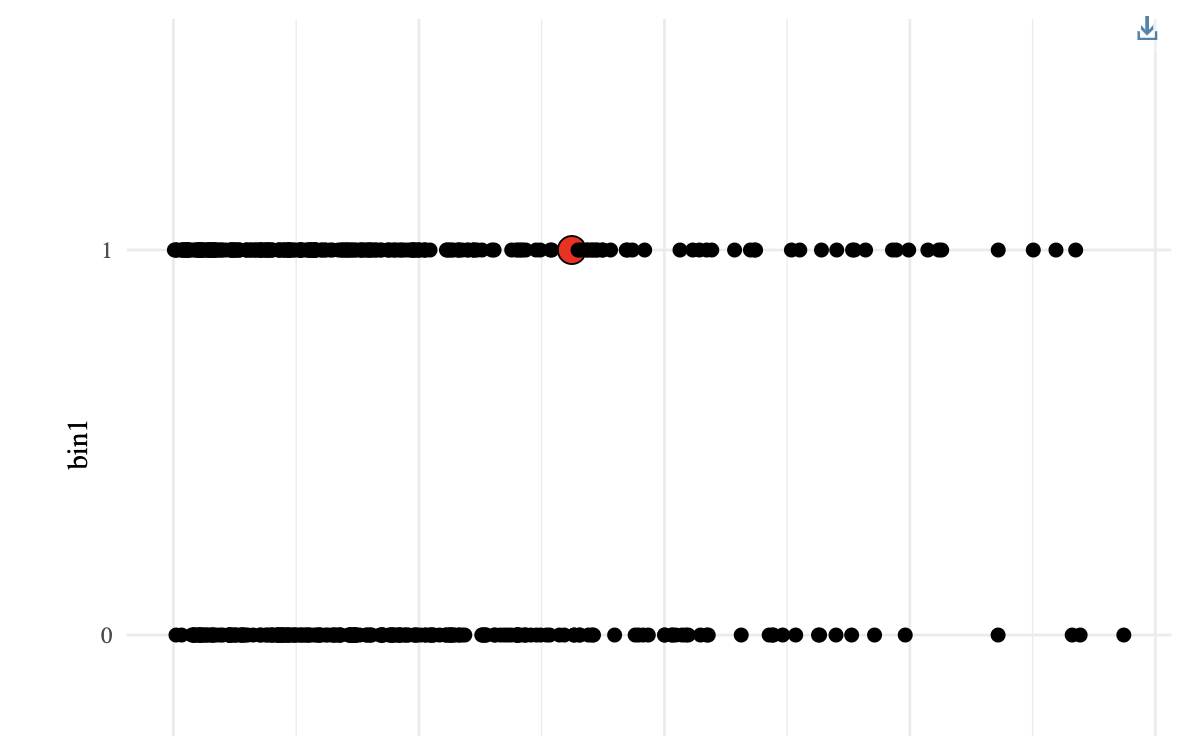
*(see ggirafe)*</br></br>
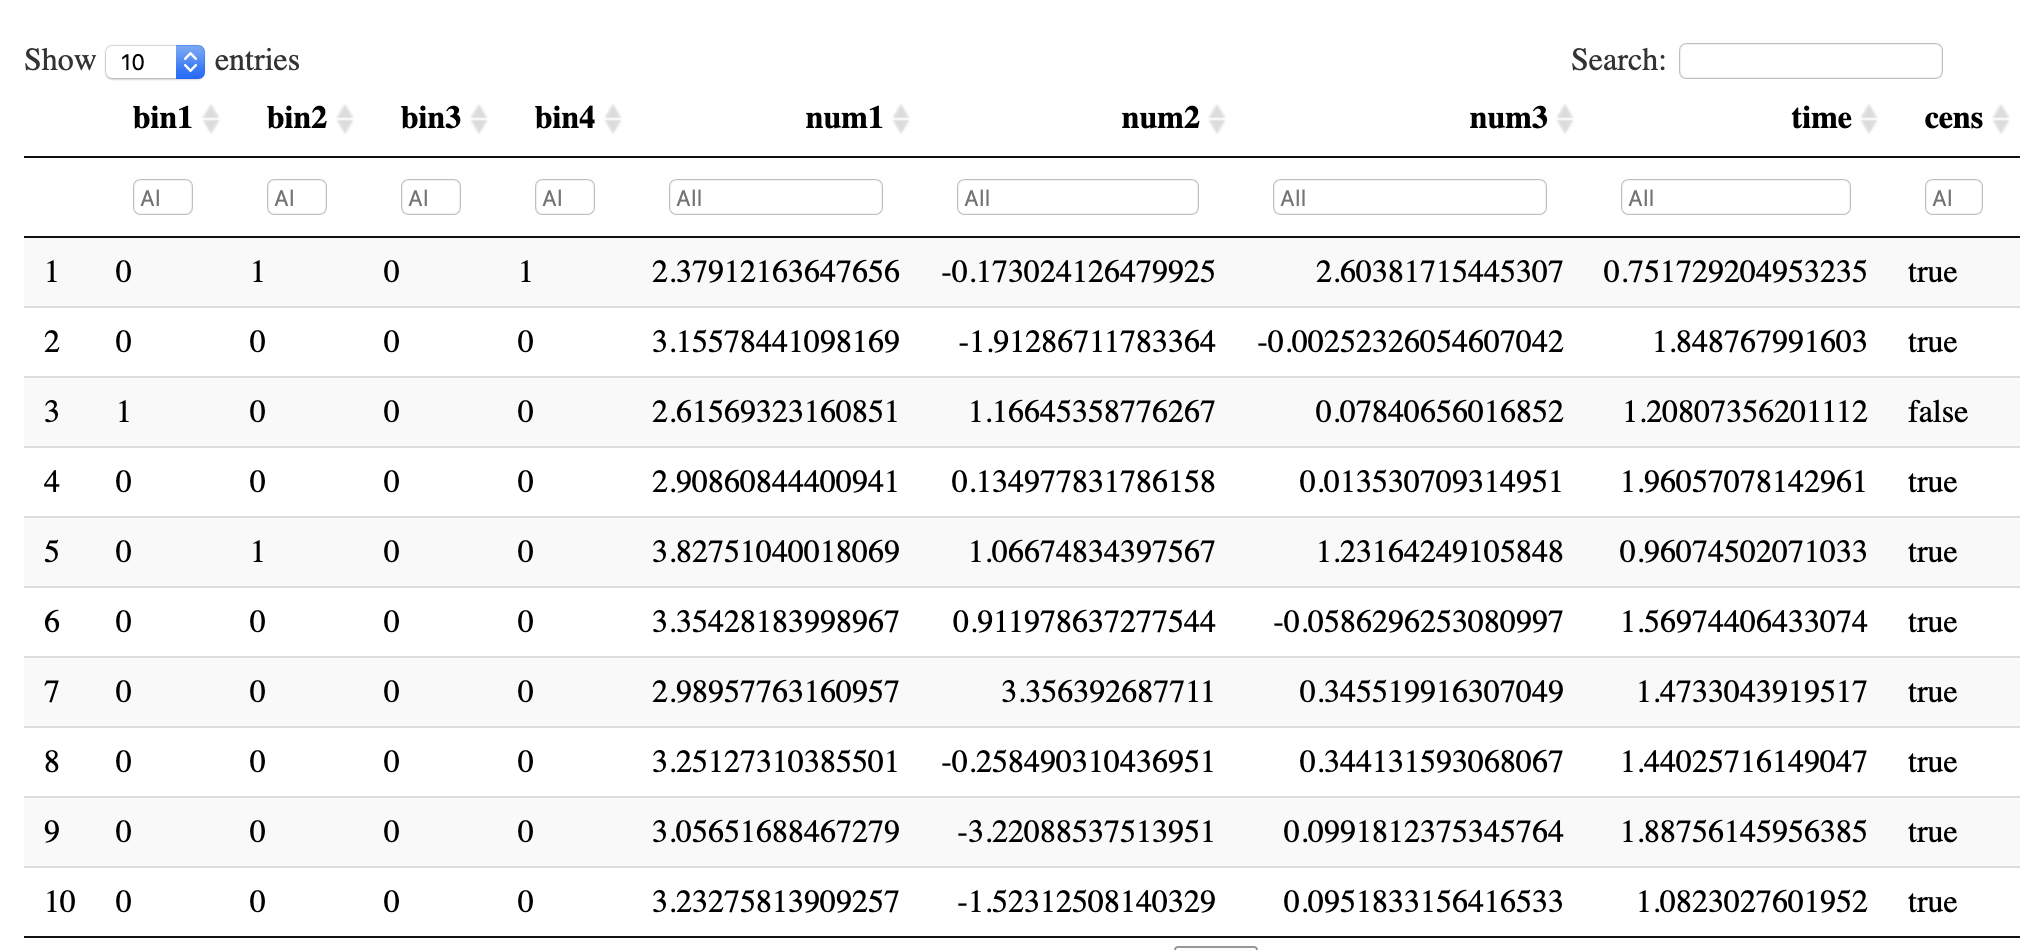
**embedDT**(dt,height="100%",width="100%",...)</br>
*Display a data frame in html beautiful table interactive in **jupyter notebook***</br>
*DT::datatable(dt,...)*
```R
embedDT(dataSim,"500px","100%",filter="top")
#if Rstudio
DT::datatable(iris,filter="top")
```
*(see embed)*</br>
## plotWH
**plotWH**(w=NULL,h=NULL)-> reset (it is a function)</br>
*Change Plot Width/height*</br>
```R
resetWH = plotWH(w=10)
... #plot graphique
resetWH() # when finish with modified width/height
```
*(options repr.plot.(width/height))*</br>
## Warnings
**showWarning()**</br>
**hideWarning()**</br>
**toggleWarning()**</br>
```R
> testit <- function() warning("testit")
> testit() #Warn
Warning message:
In testit() : testit
> hideWarning()
> testit() #not Warn
> showWarning()
> testit() #Warn
Warning message:
In testit() : testit
> toggleWarning()
> testit() #not Warn
> toggleWarning()
> testit() #Warn
Warning message:
In testit() : testit
```
**tg**(smth)</br>
*hide/suppress warnings and messages*</br>
```R
tg(smthWithWarningsOrMessages)
```
**suppressWarningsGgplot**(ggplotToPlot)</br>
*hide ggplots warnings*
```R
suppressWarningsGgplot(ggplotPlot)
```
## Reduce and Filter
### Reduce
**%reduce%(x,ops)**</br>
*Reduce list x with operator ops*</br>
*(Reduce(x,f=ops))*</br>
```R
> a=1:5
> a %reduce% "+"
[1] 15
```
### Filter
**%filter%(#list,#fn)**</br>
*Filter list with function fn*</br>
```R
> 1:5 %filter% l1__( .%%2==0 ) #SAME AS 1:5 %filter% l1_(~.%%2==0 ) #SAME AS 1:5 %filter% function(.) .%%2==0 #SAME AS 1:5 %filter% lambda(.,.%%2==0) #(see wrapr)
[1] 2 4
```
### Select Cols</br>
**catCol(#dataframe) notCatCol(#dataframe)**</br>
*Select categorical columns in #dataframe*</br>
```R
> iris %>% catCol %>% str
'data.frame': 150 obs. of 1 variable:
$ Species: Factor w/ 3 levels "setosa","versicolor",..: 1 1 1 1 1 1 1 1 1 1 ...
> iris %>% notCatCol %>% str
'data.frame': 150 obs. of 4 variables:
$ Sepal.Length: num 5.1 4.9 4.7 4.6 5 5.4 4.6 5 4.4 4.9 ...
$ Sepal.Width : num 3.5 3 3.2 3.1 3.6 3.9 3.4 3.4 2.9 3.1 ...
$ Petal.Length: num 1.4 1.4 1.3 1.5 1.4 1.7 1.4 1.5 1.4 1.5 ...
$ Petal.Width : num 0.2 0.2 0.2 0.2 0.2 0.4 0.3 0.2 0.2 0.1 ...
```
**numericCol(#dataframe) notNumericCol(#dataframe)**</br>
*Select numerical columns in #dataframe*</br>
```R
> iris %>% numericCol() %>% str
'data.frame': 150 obs. of 4 variables:
$ Sepal.Length: num 5.1 4.9 4.7 4.6 5 5.4 4.6 5 4.4 4.9 ...
$ Sepal.Width : num 3.5 3 3.2 3.1 3.6 3.9 3.4 3.4 2.9 3.1 ...
$ Petal.Length: num 1.4 1.4 1.3 1.5 1.4 1.7 1.4 1.5 1.4 1.5 ...
$ Petal.Width : num 0.2 0.2 0.2 0.2 0.2 0.4 0.3 0.2 0.2 0.1 ...
> iris %>% notNumericCol() %>% str
'data.frame': 150 obs. of 1 variable:
$ Species: Factor w/ 3 levels "setosa","versicolor",..: 1 1 1 1 1 1 1 1 1 1 ...
```
# Usefull plot </br>
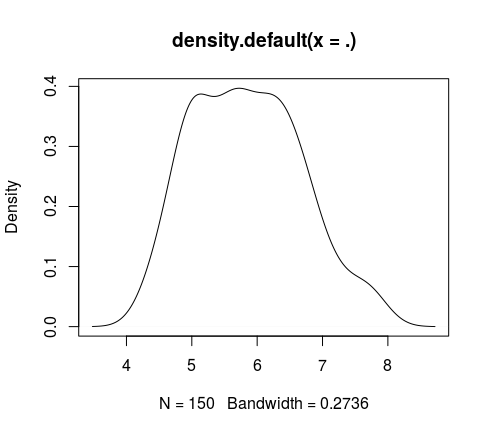
**densityPlt(#numericVector)**</br>
*Give and plot the density of the passed vector (density + plot)(stats::density)(graphics::plot)*</br>
```R
> iris %>% numericCol %getCol% 1 %>% densityPlt
```
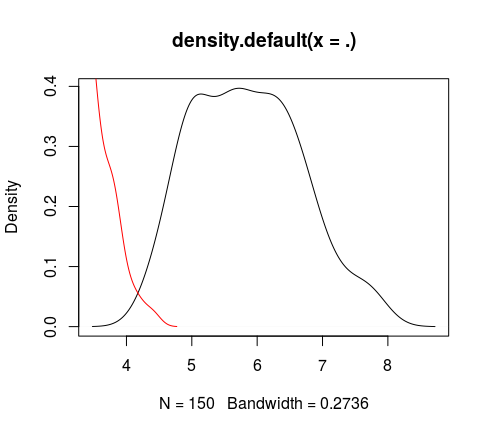
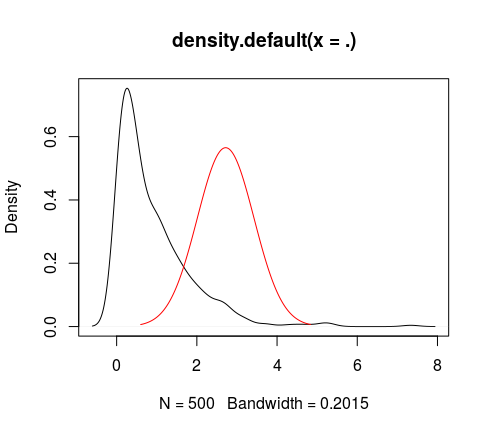
**densityLines(#numericVector)**</br>
*Give and plot the density but here use: lines (graphics::lines) (usefull for append density to an existing plot)*</br>
```R
> iris %>% numericCol %getCol% 1 %>% densityPlt
> iris %>% numericCol %getCol% 2 %>% densityLines(col="red")
#SAME
> iris %>% numericCol %getCol% 1:2 %eachFn% l_(densityPlt,densityLines(col="red")) (by default eachFn use names(), and names for data.frame is colnames)
```
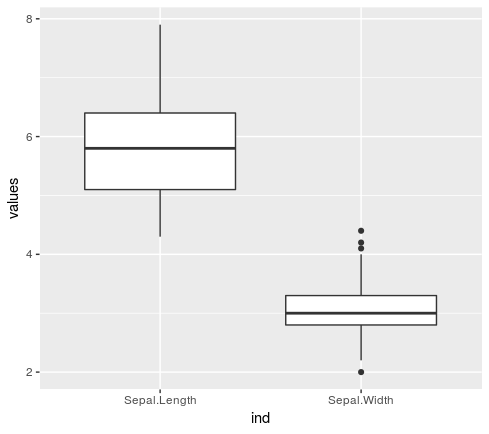
**qplotSameGraphEachCol(#matrix|#data.frame,...)**</br>
*Plot geom asked for each col in d (boxplot,violin,...)*</br>
```R
> iris %>% numericCol %getCol% 1:2 %>% qplotSameGraphEachCol(geom="boxplot")
```
**hidePlot(func)**</br>
*Hide plot printed in func (Exemple with thomasp85/patchwork)*</br>
```R
hidePlot(
{#create plots
numCol=iris %>% numericCol #select numeric cols
b=numCol %>% qplotSameGraphEachCol(geom="boxplot",main="boxplot") #plot boxplot in same graph for each cols
a=numCol %>% as.data.frame %eachCol% {l1_(qplot(.,main=.y))} %reduce% "+" # combine plots
}
)
(#combine plots
b + {
a + plot_layout(1)
} + plot_annotation("Boxplot + hist for Num Var")
) %>%
suppressWarningsGgplot
```
**loadPlotUsefull**</br>
# Usefull Library
**lib + #string|#Stringvector**</br>
*load package or if not exist, install and load it*</br>
```R
lib + "dplyr"
lib + c("purrr","wrapr") + "ggplot2" + c("git:luluperet/icor","git:thomasp85/patchwork","MASS")
lib + "git:cran/MASS"
load same as base::library
# Usefull Packages Icor
reloadIcor()
detach and load icor
update(upgrade=F,...)
Update icor package,(call install_github)
updateReloadIcor(...)
Update icor and reload
detachFast(name#string)
detach package with name
```R
detach("dplyr")
# Each + Map</br>
 ## Each
 **%each(p1#list|#atomic,p2#listFunction|#function)%**</br>
 *For each elements in p1 (or juste for the element p1), do each elements in p2 (or just do the element p2) And combine them*</br>
 *it's possible to have name with list*</br>
R
5 %each% rnorm(20,mean=.)
[,1]
[1,] 5.208568
[2,] 5.241304
[3,] 4.129042
[4,] 5.626426
[5,] 4.788172
[6,] 4.337919
[7,] 4.899254
[8,] 4.749950
[9,] 4.568605
[10,] 4.952485
[11,] 4.458688
[12,] 4.411290
[13,] 3.838677
[14,] 4.330359
[15,] 5.266607
[16,] 4.459932
[17,] 6.676035
[18,] 5.953141
[19,] 5.266492
[20,] 3.583078
5 %each% l_(~rnorm(10,mean=.),~rt(10,df = .))
[,1]
[1,] 2.8300541
[2,] 4.8927280
[3,] 4.7541910
[4,] 4.6632927
[5,] 4.7845754
[6,] 4.3860661
[7,] 6.8552386
[8,] 4.4717009
[9,] 5.9567871
[10,] 5.2502613
[11,] 0.5078755
[12,] -1.2782019
[13,] -1.8228135
[14,] 1.3138229
[15,] 2.3206288
[16,] 0.4834326
[17,] -0.1172201
[18,] -0.1487688
[19,] 2.4639320
[20,] -0.1883499
l(param1=5) %each% l_(~rnorm(5,mean=.),~rt(5,df = .))
param1
[1,] 4.9572221
[2,] 4.4964496
[3,] 5.2982058
[4,] 4.1527408
[5,] 6.2592159
[6,] 0.4093040
[7,] 0.1006199
[8,] -1.2129520
[9,] -0.1663486
[10,] 0.2167459
l(param1=5,param2=10) %each% l_(normal=~rnorm(10,mean=.),student=~rt(10,df = .))
param1 param2
[1,] 5.7367601 9.42105578
[2,] 6.0204500 11.28830180
[3,] 4.6171627 11.05506386
[4,] 3.6562342 8.31786148
[5,] 3.7550892 10.62510488
[6,] 5.5858563 10.05422571
[7,] 4.2535033 10.03610482
[8,] 3.8561362 9.58243084
[9,] 5.2993138 10.96269036
[10,] 3.8269837 12.08496308
[11,] 0.4619335 0.48020012
[12,] -0.5076719 -1.87017737
[13,] -0.5319049 -2.35908234
[14,] -1.3228157 1.50055514
[15,] -0.1864516 0.34109743
[16,] -1.1957955 0.02759116
[17,] -0.2537597 1.72938623
[18,] -1.6788381 0.65561173
[19,] 1.3222800 -0.08624319
[20,] -0.3316957 -1.05160888
**%each:(p1#list|#atomic,p2#listSpe) (see below)%**</br>
 *list spe -> !fn1:fn2:fn3:fn4  each fn will be formula*</br>
R
l(param1=5,param2=10) %each:% !rnorm(10,mean=.):rt(10,df=.)
param1 param2
[1,] 3.9852628 10.8618801
[2,] 4.0229170 10.0389925
[3,] 4.5367383 10.0185098
[4,] 4.5252521 9.9040710
[5,] 4.0988606 10.2416906
[6,] 5.2879876 11.2145030
[7,] 4.4056529 11.7918208
[8,] 5.9926545 8.6528593
[9,] 5.8810676 8.5943881
[10,] 3.9937171 12.1794355
[11,] -2.2952650 1.1307431
[12,] 1.2224384 -0.1587621
[13,] -2.3639076 0.7997264
[14,] -0.2115936 -1.1336077
[15,] -1.1214107 -1.3203418
[16,] 1.2084834 -0.1969208
[17,] -0.6580758 0.5846537
[18,] 1.4053799 -1.8358543
[19,] 0.3603988 0.7041107
[20,] -0.1773637 0.7497855
```
%eachCol%(#data.frame|#matrix,#fn) %eachRow%(#data.frame|#matrix,#fn)
for each col/row do function fn
fn = function(.,.y) (.y will be the rownames/colnames) (if the function have a parameter "..." or ".y")
```R
iris %>% numericCol %eachCol% mean
[[1]]
[1] 5.843333
[[2]]
[1] 3.057333
[[3]]
[1] 3.758
[[4]]
[1] 1.199333
iris %>% numericCol %getRow% 1:5 %eachRow% sd
[[1]]
[1] 2.179449
[[2]]
[1] 2.03695
[[3]]
[1] 1.997498
[[4]]
[1] 1.912241
[[5]]
[1] 2.156386
**%eachRowCol.%(#data.frame|#matrix,#fn)**</br>
*apply*</br>
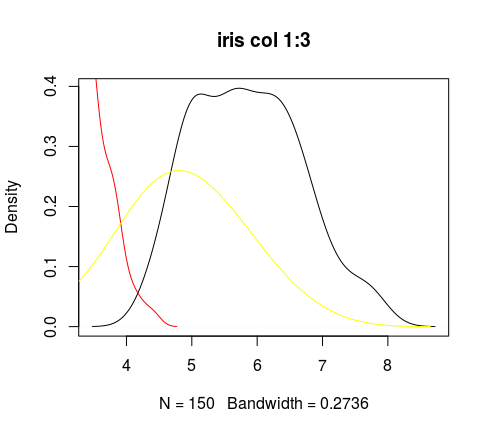
**%eachFn%(p1#list,p2#listOfFn) %eachFnTg%(p1#list,p2#listOfFn)**</br>
*call functions in p2 with the right element in the list p1 (the first element in p1 wille be the parameters of the first function in p2 *</br>
*%eachFnTg% same but don't show result*</br>R
l(10,5) %eachFn% l_(rnorm(10,.),rt(2,.))
[[1]]
[1] 11.322321 9.024418 10.128791 10.043028 9.558132 8.285182 10.534494 10.839975
[9] 8.811831 12.208134
[[2]]
[1] -0.3284563 0.9044645
iris %>% numericCol %getCol% 1:3 %eachCol% density %eachFnTg% l_(plot(main="iris col 1:3"),lines(col="red"),lines(col="yellow"))
## MAP
**%map%**</br>
*like %each% but return a list*</br>
```R
> 5 %map% l_(~rnorm(10,mean=.),~rt(10,df = .))
[[1]]
[[1]][[1]]
[1] 6.217333 7.817015 5.542896 6.197506 4.536185 6.156209 4.676093 4.671299 4.556994
[10] 5.702077
[[1]][[2]]
[1] 1.0574214 0.5550782 -1.2997765 -0.7669661 0.7797546 -0.3401625 1.2158549
[8] -0.8133232 0.2269967 -0.2361220
> l(param1=5) %map% l_(normal=~rnorm(10,mean=.),student=~rt(10,df = .))
$param1
$param1$normal
[1] 4.753331 5.201445 5.393153 4.636426 5.450957 5.222474 5.324348 5.826944 4.682138
[10] 5.813726
$param1$student
[1] -0.44942978 -0.14939527 0.02807041 2.53607663 0.66900864 0.01629510 -0.58214031
[8] -0.03030529 0.43651053 0.92873499
> l(param1=5,param2=10) %map% l_(normal=~rnorm(10,mean=.),student=~rt(10,df = .))
$param1
$param1$normal
[1] 5.032082 7.148801 6.323189 7.157312 3.455346 4.563776 4.200298 4.865634 4.702481
[10] 2.249695
$param1$student
[1] -0.8267602 -0.2121175 0.4930985 -0.3130002 1.5606819 -0.7043366 1.0136329
[8] -0.2031532 -0.8199970 -0.6048155
$param2
$param2$normal
[1] 9.895135 10.596231 9.490120 8.964490 10.597482 11.479018 9.687607 10.212865
[9] 10.504445 10.689903
$param2$student
[1] 0.77245027 -0.51654366 0.54893002 0.84684148 0.41709451 1.84699802 0.17552991
[8] -1.24288775 0.01882849 -1.45396199
```
**%mapFns%**</br>
*invoke_map*</br>
%Xtimes%</br>
# List Sequence Formula Customize</br>
formulatoList.</br>
%from%</br>
# Getter </br>
%getCol% %getRow% %getCol.% %getRow.%</br>
%getElem% %getElem2% %getElems%</br>
# Icor</br>
icor</br>
icor.corrToStudent</br>
icor.critical.r</br>
icor.studentToCorr</br>
icor.graph</br>
# Lists</br>
## LISTS OPS
*%#1,#2%*</br>
* #1 must be constructed with _ and .*</br>
* if you want that the left side must be interprete with "l_", you have to write _ for the left (#1)%</br>
* *1 = _ *</br>
* if you want #2 be normal like "l", just write nothing for #1 *</br>
* #1 = _ *</br>
* #2 = *</br>
* Operator = %_,%*</br>
```R
> rnorm(3) %_,% rnorm(3) #SAME AS l( l1_(rnorm(3)), rnorm(3) )
[[1]]
<icor_list>
function (..., .x = ..1, .y = ..2, . = ..1)
rnorm(., 3)
[[2]]
[1] 0.2080809 1.2826301 -0.4169875
```
* if you want you can change the #2, with "__" for interprete the right side with "l__"*</br>
```R
> rnorm(3) %_,__% rnorm(3) #SAME AS l( l1_(rnorm(3)), l1__(rnorm(3)) )
[[1]]
<icor_list>
function (..., .x = ..1, .y = ..2, . = ..1)
rnorm(., 3)
[[2]]
<icor_list>
function (..., .x = ..1, .y = ..2, . = ..1)
rnorm(3)
```
**l l. lx ln lx. ln. %,% %.,.% %.,% %,.% **</br>
*normal list but understand .()*</br>
```R
> i = 3
> l(.(i),4) #SAME .(i) %,% 4
[[1]]
[1] 3
[[2]]
[1] 4
> l.(.(i),4) #SAME .(i) %.,% 4
Error in .(i) : impossible de trouver la fonction "."
ll
normal list but nested list(list())
l_ lx_ ln_ l1_ %,% %,% %,% %__,% %___,% AND symetrics
normal list but for each parameters return a function | l1_ return the first one | %,%
a parameter: function, formula
```R
l_(
rnorm(1),
~rnorm(4),
{ rnorm(mean=4)},
rnorm
) #SAME rnorm(1) %,% (~rnorm(4)) %,% { rnorm(mean=4) } %,% rnorm
[[1]]
function (..., .x = ..1, .y = ..2, . = ..1)
rnorm(., 1)
[[2]]
function (..., .x = ..1, .y = ..2, . = ..1)
rnorm(4)
[[3]]
function (..., .x = ..1, .y = ..2, . = ..1)
{
rnorm(mean = 4)
}
[[4]]
function (..., .x = ..1, .y = ..2, . = ..1)
rnorm(.)
l1_(
rnorm(1),
~rnorm(4),
{ rnorm(mean=4) },
rnorm
) # SAME AS rnorm(1) %,% (~rnorm(4)) %,% { rnorm(mean=4) } %,% rnorm %...>% l1
function (..., .x = ..1, .y = ..2, . = ..1)
rnorm(., 1)
3 %,_% rnorm(1)
[[1]]
[1] 3
[[2]]
function (..., .x = ..1, .y = ..2, . = ..1)
rnorm(., 1)
```
l__ %__,__% %__,_% %__,% AND symetrics
l___
%listToDotsFn_% %listToDotsFn%
# StrCls
StrCls
?? lapplys ??
# Tests
test_normal
test_same_distrib
# Future
(HenrikBengtsson/future)
%future%
//e= d %>% girafe(ggobj = .) %>% girafe_options(opts_hover(css = "fill:red;r:4pt;"))
luluperet/icor documentation built on May 26, 2019, 6:54 p.m.
R Package Documentation
Browse R Packages
We want your feedback!
Note that we can't provide technical support on individual packages. You should contact the package authors for that.
ICOR, Correlation and Usefull Functions, Operators and Classes
EXAMPLES
iris %>%
numericCol %getCol%
1:4 %>skip>% {
layout_build_matrix(
1,2,3|
0,4,0
);
resetPlt = plotWH(7,5)
}%each% l__(
{
name=names(dimnames(.))
hist(.x,xlab = name,main = name%.%" hist + Density",probability = T);
densityLines(.x,col="red")
}
) %>% invisible
#SAME
#We use eachCol instead of each (.y is the colname)
#We use tg instead of invisible (same, but remove warnings too)
iris %>%
numericCol %getCol%
1:4 %>skip>% {
layout_build_matrix(
1,2,3|
0,4,0
);
resetPlt = plotWH(7,5)
} %eachCol% l1__(
{
name=.y
hist(.x,xlab = name,main = name%.%" hist + Density",probability = T);
densityLines(.x,col="red")
}
) %>% tg
EQ
Test values each in vector < <= == >= > %||% ```R
c(4,2,1) %||% c(9,4,0) < 3 [1] FALSE
**%|%**</br>R c(4,2,1) %|% c(9,4,0) < 3 [1] FALSE TRUE TRUE**%&&%** </br>R c(4,2,1) %&&% c(9,4,0) < 3 [1] FALSE**%&%**</br>R c(4,2,1) %&% c(9,4,0) < 3 [1] FALSE FALSE TRUE ```
list To Parameters of a Function
Call function of the right side, with elements of the list passed in the left side
Operators
%...>%(#list|#atomic,#function) (keep names) ```R
list(mean=10,n=5,sd = 2) %...>% rnorm [1] 12.817348 10.284119 11.355081 7.372176 7.795275
list(mean=10,n=5,sd = 2) %...>% smth List of 3 $ mean: num 10 $ n : num 5 $ sd : num 2
10 %,% 20 %...>% rnorm [1] 19.51830 19.32193 17.89852 20.27248 19.79469 22.44875 21.06525 22.81541 20.42578 [10] 20.35683
(see #icor_lists below)
10 %...>% rnorm [1] 0.88250520 -1.06436486 0.44685920 -0.58315920 1.05593594 0.28902886 -0.01550811 [8] 0.76758399 2.07238604 -0.86256077
**%..._>%(#list|#atomic,#function) (not keep names)**R
list(mean=10,n=5,sd = 2) %..._>% rnorm [1] 4.5024198 8.4893204 10.0372266 4.5468650 3.7732437 4.1219222 [7] 3.7688349 0.1318678 0.9097222 7.8097455
list(mean=10,n=5,sd = 2) %..._>% smth List of 3 $ : num 10 $ : num 5 $ : num 2
10 %,% 20 %...>% rnorm [1] 20.33436 19.57912 19.15201 18.57136 19.53694 19.09004 18.62865 19.14920 19.08933 [10] 19.00091
#(see #icor_lists below)
10 %..._>% rnorm [1] 0.88250520 -1.06436486 0.44685920 -0.58315920 1.05593594 0.28902886 -0.01550811 [8] 0.76758399 2.07238604 -0.86256077
**%listToDotsFn%(#list,#function) (keep names)**R
list(mean=10,n=5,sd = 2) %listToDotsFn% rnorm [1] 11.396479 10.744122 8.012919 11.297808 12.601390
list(ind="a",day=3,month=4) %listToDotsFn% smth List of 3 $ ind : chr "a" $ day : num 3 $ month: num 4
**%listToDotsFn_%(#list,#function) (not keep names)**
*(see "smth" below)*</br>R
list(ind="a",day=3,month=4) %listToDotsFn_% smth List of 3 $ : chr "a" $ : num 3 $ : num 4
10 %,% 20 %listToDotsFn_% rnorm [1] 20.33436 19.57912 19.15201 18.57136 19.53694 19.09004 18.62865 19.14920 19.08933 [10] 19.00091
(see #icor_lists below)
```
String Concat
%.=% Concat and assign Strings
> a="Hello "
> a %.=% "World"
> cat(a)
Hello World
%.% Concat strings (paste0) ```R
"ll"%.%"kk"%.%"kkd" [1] "llkkkkd" ```
Usefull Utils
curry(fn) (Currying)[https://en.wikipedia.org/wiki/Currying] ```R
a=curry(rnorm(10)) a function (...) rnorm(10, ...) a(10) [1] 9.822035 9.897887 10.289826 9.588149 9.705572 11.554598 [7] 11.485561 8.851399 12.550492 10.740860
**smth**</br> *Return str of list of dots* w/br>R 3 %,% 4 %,% l(d=3) %->% smth List of 3 $ : num 3 $ : num 4 $ :List of 1 ..$ d: num 3smth(1,2,3,4,5,"kkk",rnorm,l1___(rnorm(10))) List of 8 $ : num 1 $ : num 2 $ : num 3 $ : num 4 $ : num 5 $ : chr "kkk" $ :function (n, mean = 0, sd = 1) $ :function (...) ..- attr(, "class")= chr [1:2] "purrr_function_partial" "function" ..- attr(, "body")= language ~(function (n, mean = 0, sd = 1) .Call(C_rnorm, n, mean, sd))(10, ...) .. ..- attr(, ".Environment")= ..- attr(, "fn")= symbol rnorm
**startsWithFromList(list,string)**</br>
*filter list with element who begin with string*</br>R
c("hello","he lo","hehe","bonjour","au revoir") %>% startsWithFromList("he") [1] "hello" "he lo" "hehe"
**addNamesToList(list,names)**</br>
*add names to list*</br>R
c("hello","he lo","hehe","bonjour","au revoir") %>% addNamesToList(1:5) 1 2 3 4 5 "hello" "he lo" "hehe" "bonjour" "au revoir"
c("hello","he lo","hehe","bonjour","au revoir") %>% addNamesToList(1:5 %each% {"d"%.%.}) d1 d2 d3 d4 d5 "hello" "he lo" "hehe" "bonjour" "au revoir"
l("hello","he lo","hehe","bonjour","au revoir") %>% addNamesToList(1:5 %each% {"d"%.%.}) $d1 [1] "hello"
$d2 [1] "he lo"
$d3 [1] "hehe"
$d4 [1] "bonjour"
$d5 [1] "au revoir"
``` nothing(...) return nothing with whatever params
%call%(#fn,#list) *call fn with elements of list as parameters
%>skip>%(data,#fn) doAndSkip %-|skip|->% Execute fn and return data ! all above do the same
Usefull DataFrame
toDF(list) toDFt(list) convert an list to a dataframe with good colnames, rownames ```R
l("hello","he lo","hehe","bonjour","au revoir") %>% addNamesToList(1:5 %each% {"d"%.%.}) %>% toDF [,1] d1 "hello" d2 "he lo" d3 "hehe" d4 "bonjour" d5 "au revoir"
l("hello","he lo","hehe","bonjour","au revoir") %>% addNamesToList(1:5 %each% {"d"%.%.}) %>% toDFt d1 d2 d3 d4 d5 1 hello he lo hehe bonjour au revoir
**add_row_with_name(#data.frame)**</br>
*add row with rowname in a data frame*</br>R
data.frame(a=6:10,b=1:5%each%{"b"%.%.}) a b 1 6 b1 2 7 b2 3 8 b3 4 9 b4 5 10 b5
data.frame(a=6:10,b=1:5%each%{"b"%.%.}) %>% add_row_with_name(a=9,b="b5",name="9") a b 1 6 b1 2 7 b2 3 8 b3 4 9 b4 5 10 b5 9 9 b5
**dfRowToList**</br>
*convert row of data frame to list*</br>R
data.frame(a=6:10,b=1:5%each%{"b"%.%.}) %>% dfRowToList $V1 a b 6 b1 Levels: 6 b1
$V2 a b 7 b2 Levels: 7 b2
$V3 a b 8 b3 Levels: 8 b3
$V4 a b 9 b4 Levels: 9 b4
$V5 a b 10 b5 Levels: 10 b5
**dfToHTML(#data.frame)**</br>
*show an data frame in html (only in jupyter notebook)*</br>

# Aleatoire</br>
Aleatoire</br>
# Categorical</br>
**corrCatCon(#vector,#vector)**</br>
*graph of the values in the first params for each cat in the second parameters*</br>R
iris$Sepal.Length %,% iris$Species %...>% graphCatCon
#SAME AS graphCatCon(iris$Sepal.Length,iris$Species)
#SAME AS iris %$% graphCatCon(Sepal.Length,Species)
```
%by% create list with as name differents categories and as value, the value associate with this value ```R
iris$Sepal.Length %by% iris$Species $setosa [1] 5.1 4.9 4.7 4.6 5.0 5.4 4.6 5.0 4.4 4.9 5.4 4.8 4.8 4.3 5.8 5.7 5.4 5.1 5.7 5.1 5.4 [22] 5.1 4.6 5.1 4.8 5.0 5.0 5.2 5.2 4.7 4.8 5.4 5.2 5.5 4.9 5.0 5.5 4.9 4.4 5.1 5.0 4.5 [43] 4.4 5.0 5.1 4.8 5.1 4.6 5.3 5.0
$versicolor [1] 7.0 6.4 6.9 5.5 6.5 5.7 6.3 4.9 6.6 5.2 5.0 5.9 6.0 6.1 5.6 6.7 5.6 5.8 6.2 5.6 5.9 [22] 6.1 6.3 6.1 6.4 6.6 6.8 6.7 6.0 5.7 5.5 5.5 5.8 6.0 5.4 6.0 6.7 6.3 5.6 5.5 5.5 6.1 [43] 5.8 5.0 5.6 5.7 5.7 6.2 5.1 5.7
$virginica [1] 6.3 5.8 7.1 6.3 6.5 7.6 4.9 7.3 6.7 7.2 6.5 6.4 6.8 5.7 5.8 6.4 6.5 7.7 7.7 6.0 6.9 [22] 5.6 7.7 6.3 6.7 7.2 6.2 6.1 6.4 7.2 7.4 7.9 6.4 6.3 6.1 7.7 6.3 6.4 6.0 6.9 6.7 6.9 [43] 5.8 6.8 6.7 6.7 6.3 6.5 6.2 5.9
**%byGraph**</br>
*same as %by% but plot graph(see corrCatCon) of values for differents cat (only works if the right arguments is a vector)*</br>R
iris$Sepal.Length %byGraph% iris$Species $setosa [1] 5.1 4.9 4.7 4.6 5.0 5.4 4.6 5.0 4.4 4.9 5.4 4.8 4.8 4.3 5.8 5.7 5.4 5.1 5.7 5.1 5.4 [22] 5.1 4.6 5.1 4.8 5.0 5.0 5.2 5.2 4.7 4.8 5.4 5.2 5.5 4.9 5.0 5.5 4.9 4.4 5.1 5.0 4.5 [43] 4.4 5.0 5.1 4.8 5.1 4.6 5.3 5.0
$versicolor [1] 7.0 6.4 6.9 5.5 6.5 5.7 6.3 4.9 6.6 5.2 5.0 5.9 6.0 6.1 5.6 6.7 5.6 5.8 6.2 5.6 5.9 [22] 6.1 6.3 6.1 6.4 6.6 6.8 6.7 6.0 5.7 5.5 5.5 5.8 6.0 5.4 6.0 6.7 6.3 5.6 5.5 5.5 6.1 [43] 5.8 5.0 5.6 5.7 5.7 6.2 5.1 5.7
$virginica [1] 6.3 5.8 7.1 6.3 6.5 7.6 4.9 7.3 6.7 7.2 6.5 6.4 6.8 5.7 5.8 6.4 6.5 7.7 7.7 6.0 6.9 [22] 5.6 7.7 6.3 6.7 7.2 6.2 6.1 6.4 7.2 7.4 7.9 6.4 6.3 6.1 7.7 6.3 6.4 6.0 6.9 6.7 6.9 [43] 5.8 6.8 6.7 6.7 6.3 6.5 6.2 5.9

**int.hist**</br>
# Usefull Utils</br>
## capture</br>
**captureCat**</br>
*capture in a variable the result of the cat function for the given parameter*</br>R
a=1:5 a [1] 1 2 3 4 5 az=captureCat(a) az [1] "1 2 3 4 5"
*capturePrint*</br>
*capture in a variable the result of the cat function for the given parameter*</br>R
a=lm(Petal.Width ~ Sepal.Length,data=iris) print(a)
Call: lm(formula = Petal.Width ~ Sepal.Length, data = iris)
Coefficients: (Intercept) Sepal.Length -3.2002 0.7529
az=capturePrint(a) az [1] "" [2] "Call:" [3] "lm(formula = Petal.Width ~ Sepal.Length, data = iris)" [4] "" [5] "Coefficients:" [6] " (Intercept) Sepal.Length " [7] " -3.2002 0.7529 " [8] ""
## embed</br>
**embed**(x, height="100%",width="100%") </br>
*Display widget x, in html in jupyter notebook*</br>
*(see DT::datatable)*</br></br>R
graph=dataSim %>% ggplot(aes(x=time,y=bin1)) + geom_point() + geom_point_interactive(aes(data_id=rownames(dataSim)), size = 2) + theme_minimal()
graphWidget= graph %>% girafe(ggobj = .) %>% girafe_options(opts_hover(css = "fill:red;r:4pt;"))
embed(graphWidget,"500px","70%")

*(see ggirafe)*</br></br>
**embedDT**(dt,height="100%",width="100%",...)</br>
*Display a data frame in html beautiful table interactive in **jupyter notebook***</br>
*DT::datatable(dt,...)*
```R
embedDT(dataSim,"500px","100%",filter="top")
#if Rstudio
DT::datatable(iris,filter="top")
```

*(see embed)*</br>
## plotWH
**plotWH**(w=NULL,h=NULL)-> reset (it is a function)</br>
*Change Plot Width/height*</br>
```R
resetWH = plotWH(w=10)
... #plot graphique
resetWH() # when finish with modified width/height
```
*(options repr.plot.(width/height))*</br>
## Warnings
**showWarning()**</br>
**hideWarning()**</br>
**toggleWarning()**</br>
```R
> testit <- function() warning("testit")
> testit() #Warn
Warning message:
In testit() : testit
> hideWarning()
> testit() #not Warn
> showWarning()
> testit() #Warn
Warning message:
In testit() : testit
> toggleWarning()
> testit() #not Warn
> toggleWarning()
> testit() #Warn
Warning message:
In testit() : testit
```
**tg**(smth)</br>
*hide/suppress warnings and messages*</br>
```R
tg(smthWithWarningsOrMessages)
```
**suppressWarningsGgplot**(ggplotToPlot)</br>
*hide ggplots warnings*
```R
suppressWarningsGgplot(ggplotPlot)
```
## Reduce and Filter
### Reduce
**%reduce%(x,ops)**</br>
*Reduce list x with operator ops*</br>
*(Reduce(x,f=ops))*</br>
```R
> a=1:5
> a %reduce% "+"
[1] 15
```
### Filter
**%filter%(#list,#fn)**</br>
*Filter list with function fn*</br>
```R
> 1:5 %filter% l1__( .%%2==0 ) #SAME AS 1:5 %filter% l1_(~.%%2==0 ) #SAME AS 1:5 %filter% function(.) .%%2==0 #SAME AS 1:5 %filter% lambda(.,.%%2==0) #(see wrapr)
[1] 2 4
```
### Select Cols</br>
**catCol(#dataframe) notCatCol(#dataframe)**</br>
*Select categorical columns in #dataframe*</br>
```R
> iris %>% catCol %>% str
'data.frame': 150 obs. of 1 variable:
$ Species: Factor w/ 3 levels "setosa","versicolor",..: 1 1 1 1 1 1 1 1 1 1 ...
> iris %>% notCatCol %>% str
'data.frame': 150 obs. of 4 variables:
$ Sepal.Length: num 5.1 4.9 4.7 4.6 5 5.4 4.6 5 4.4 4.9 ...
$ Sepal.Width : num 3.5 3 3.2 3.1 3.6 3.9 3.4 3.4 2.9 3.1 ...
$ Petal.Length: num 1.4 1.4 1.3 1.5 1.4 1.7 1.4 1.5 1.4 1.5 ...
$ Petal.Width : num 0.2 0.2 0.2 0.2 0.2 0.4 0.3 0.2 0.2 0.1 ...
```
**numericCol(#dataframe) notNumericCol(#dataframe)**</br>
*Select numerical columns in #dataframe*</br>
```R
> iris %>% numericCol() %>% str
'data.frame': 150 obs. of 4 variables:
$ Sepal.Length: num 5.1 4.9 4.7 4.6 5 5.4 4.6 5 4.4 4.9 ...
$ Sepal.Width : num 3.5 3 3.2 3.1 3.6 3.9 3.4 3.4 2.9 3.1 ...
$ Petal.Length: num 1.4 1.4 1.3 1.5 1.4 1.7 1.4 1.5 1.4 1.5 ...
$ Petal.Width : num 0.2 0.2 0.2 0.2 0.2 0.4 0.3 0.2 0.2 0.1 ...
> iris %>% notNumericCol() %>% str
'data.frame': 150 obs. of 1 variable:
$ Species: Factor w/ 3 levels "setosa","versicolor",..: 1 1 1 1 1 1 1 1 1 1 ...
```
# Usefull plot </br>
**densityPlt(#numericVector)**</br>
*Give and plot the density of the passed vector (density + plot)(stats::density)(graphics::plot)*</br>
```R
> iris %>% numericCol %getCol% 1 %>% densityPlt
```

**densityLines(#numericVector)**</br>
*Give and plot the density but here use: lines (graphics::lines) (usefull for append density to an existing plot)*</br>
```R
> iris %>% numericCol %getCol% 1 %>% densityPlt
> iris %>% numericCol %getCol% 2 %>% densityLines(col="red")
#SAME
> iris %>% numericCol %getCol% 1:2 %eachFn% l_(densityPlt,densityLines(col="red")) (by default eachFn use names(), and names for data.frame is colnames)
```

**qplotSameGraphEachCol(#matrix|#data.frame,...)**</br>
*Plot geom asked for each col in d (boxplot,violin,...)*</br>
```R
> iris %>% numericCol %getCol% 1:2 %>% qplotSameGraphEachCol(geom="boxplot")
```

**hidePlot(func)**</br>
*Hide plot printed in func (Exemple with thomasp85/patchwork)*</br>
```R
hidePlot(
{#create plots
numCol=iris %>% numericCol #select numeric cols
b=numCol %>% qplotSameGraphEachCol(geom="boxplot",main="boxplot") #plot boxplot in same graph for each cols
a=numCol %>% as.data.frame %eachCol% {l1_(qplot(.,main=.y))} %reduce% "+" # combine plots
}
)
(#combine plots
b + {
a + plot_layout(1)
} + plot_annotation("Boxplot + hist for Num Var")
) %>%
suppressWarningsGgplot
```

**loadPlotUsefull**</br>
# Usefull Library
**lib + #string|#Stringvector**</br>
*load package or if not exist, install and load it*</br>
```R
lib + "dplyr"
lib + c("purrr","wrapr") + "ggplot2" + c("git:luluperet/icor","git:thomasp85/patchwork","MASS")
lib + "git:cran/MASS"
load same as base::library # Usefull Packages Icor reloadIcor() detach and load icor update(upgrade=F,...) Update icor package,(call install_github) updateReloadIcor(...) Update icor and reload detachFast(name#string) detach package with name ```R detach("dplyr")
# Each + Map</br>
## Each
**%each(p1#list|#atomic,p2#listFunction|#function)%**</br>
*For each elements in p1 (or juste for the element p1), do each elements in p2 (or just do the element p2) And combine them*</br>
*it's possible to have name with list*</br>R
5 %each% rnorm(20,mean=.) [,1] [1,] 5.208568 [2,] 5.241304 [3,] 4.129042 [4,] 5.626426 [5,] 4.788172 [6,] 4.337919 [7,] 4.899254 [8,] 4.749950 [9,] 4.568605 [10,] 4.952485 [11,] 4.458688 [12,] 4.411290 [13,] 3.838677 [14,] 4.330359 [15,] 5.266607 [16,] 4.459932 [17,] 6.676035 [18,] 5.953141 [19,] 5.266492 [20,] 3.583078
5 %each% l_(~rnorm(10,mean=.),~rt(10,df = .)) [,1] [1,] 2.8300541 [2,] 4.8927280 [3,] 4.7541910 [4,] 4.6632927 [5,] 4.7845754 [6,] 4.3860661 [7,] 6.8552386 [8,] 4.4717009 [9,] 5.9567871 [10,] 5.2502613 [11,] 0.5078755 [12,] -1.2782019 [13,] -1.8228135 [14,] 1.3138229 [15,] 2.3206288 [16,] 0.4834326 [17,] -0.1172201 [18,] -0.1487688 [19,] 2.4639320 [20,] -0.1883499
l(param1=5) %each% l_(~rnorm(5,mean=.),~rt(5,df = .)) [,1] [1,] 2.8300541 [2,] 4.8927280 [3,] 4.7541910 [4,] 4.6632927 [5,] 4.7845754 [6,] 4.3860661 [7,] 6.8552386 [8,] 4.4717009 [9,] 5.9567871 [10,] 5.2502613 [11,] 0.5078755 [12,] -1.2782019 [13,] -1.8228135 [14,] 1.3138229 [15,] 2.3206288 [16,] 0.4834326 [17,] -0.1172201 [18,] -0.1487688 [19,] 2.4639320 [20,] -0.1883499
l(param1=5) %each% l_(~rnorm(5,mean=.),~rt(5,df = .)) param1 [1,] 4.9572221 [2,] 4.4964496 [3,] 5.2982058 [4,] 4.1527408 [5,] 6.2592159 [6,] 0.4093040 [7,] 0.1006199 [8,] -1.2129520 [9,] -0.1663486 [10,] 0.2167459
l(param1=5,param2=10) %each% l_(normal=~rnorm(10,mean=.),student=~rt(10,df = .)) param1 param2 [1,] 5.7367601 9.42105578 [2,] 6.0204500 11.28830180 [3,] 4.6171627 11.05506386 [4,] 3.6562342 8.31786148 [5,] 3.7550892 10.62510488 [6,] 5.5858563 10.05422571 [7,] 4.2535033 10.03610482 [8,] 3.8561362 9.58243084 [9,] 5.2993138 10.96269036 [10,] 3.8269837 12.08496308 [11,] 0.4619335 0.48020012 [12,] -0.5076719 -1.87017737 [13,] -0.5319049 -2.35908234 [14,] -1.3228157 1.50055514 [15,] -0.1864516 0.34109743 [16,] -1.1957955 0.02759116 [17,] -0.2537597 1.72938623 [18,] -1.6788381 0.65561173 [19,] 1.3222800 -0.08624319 [20,] -0.3316957 -1.05160888
**%each:(p1#list|#atomic,p2#listSpe) (see below)%**</br>
*list spe -> !fn1:fn2:fn3:fn4 each fn will be formula*</br>R
l(param1=5,param2=10) %each:% !rnorm(10,mean=.):rt(10,df=.) param1 param2 [1,] 3.9852628 10.8618801 [2,] 4.0229170 10.0389925 [3,] 4.5367383 10.0185098 [4,] 4.5252521 9.9040710 [5,] 4.0988606 10.2416906 [6,] 5.2879876 11.2145030 [7,] 4.4056529 11.7918208 [8,] 5.9926545 8.6528593 [9,] 5.8810676 8.5943881 [10,] 3.9937171 12.1794355 [11,] -2.2952650 1.1307431 [12,] 1.2224384 -0.1587621 [13,] -2.3639076 0.7997264 [14,] -0.2115936 -1.1336077 [15,] -1.1214107 -1.3203418 [16,] 1.2084834 -0.1969208 [17,] -0.6580758 0.5846537 [18,] 1.4053799 -1.8358543 [19,] 0.3603988 0.7041107 [20,] -0.1773637 0.7497855
```
%eachCol%(#data.frame|#matrix,#fn) %eachRow%(#data.frame|#matrix,#fn) for each col/row do function fn fn = function(.,.y) (.y will be the rownames/colnames) (if the function have a parameter "..." or ".y") ```R
iris %>% numericCol %eachCol% mean [[1]] [1] 5.843333
[[2]] [1] 3.057333
[[3]] [1] 3.758
[[4]] [1] 1.199333
iris %>% numericCol %getRow% 1:5 %eachRow% sd [[1]] [1] 2.179449
[[2]] [1] 2.03695
[[3]] [1] 1.997498
[[4]] [1] 1.912241
[[5]] [1] 2.156386
**%eachRowCol.%(#data.frame|#matrix,#fn)**</br>
*apply*</br>
**%eachFn%(p1#list,p2#listOfFn) %eachFnTg%(p1#list,p2#listOfFn)**</br>
*call functions in p2 with the right element in the list p1 (the first element in p1 wille be the parameters of the first function in p2 *</br>
*%eachFnTg% same but don't show result*</br>R
l(10,5) %eachFn% l_(rnorm(10,.),rt(2,.)) [[1]] [1] 11.322321 9.024418 10.128791 10.043028 9.558132 8.285182 10.534494 10.839975 [9] 8.811831 12.208134
[[2]] [1] -0.3284563 0.9044645
iris %>% numericCol %getCol% 1:3 %eachCol% density %eachFnTg% l_(plot(main="iris col 1:3"),lines(col="red"),lines(col="yellow"))

## MAP
**%map%**</br>
*like %each% but return a list*</br>
```R
> 5 %map% l_(~rnorm(10,mean=.),~rt(10,df = .))
[[1]]
[[1]][[1]]
[1] 6.217333 7.817015 5.542896 6.197506 4.536185 6.156209 4.676093 4.671299 4.556994
[10] 5.702077
[[1]][[2]]
[1] 1.0574214 0.5550782 -1.2997765 -0.7669661 0.7797546 -0.3401625 1.2158549
[8] -0.8133232 0.2269967 -0.2361220
> l(param1=5) %map% l_(normal=~rnorm(10,mean=.),student=~rt(10,df = .))
$param1
$param1$normal
[1] 4.753331 5.201445 5.393153 4.636426 5.450957 5.222474 5.324348 5.826944 4.682138
[10] 5.813726
$param1$student
[1] -0.44942978 -0.14939527 0.02807041 2.53607663 0.66900864 0.01629510 -0.58214031
[8] -0.03030529 0.43651053 0.92873499
> l(param1=5,param2=10) %map% l_(normal=~rnorm(10,mean=.),student=~rt(10,df = .))
$param1
$param1$normal
[1] 5.032082 7.148801 6.323189 7.157312 3.455346 4.563776 4.200298 4.865634 4.702481
[10] 2.249695
$param1$student
[1] -0.8267602 -0.2121175 0.4930985 -0.3130002 1.5606819 -0.7043366 1.0136329
[8] -0.2031532 -0.8199970 -0.6048155
$param2
$param2$normal
[1] 9.895135 10.596231 9.490120 8.964490 10.597482 11.479018 9.687607 10.212865
[9] 10.504445 10.689903
$param2$student
[1] 0.77245027 -0.51654366 0.54893002 0.84684148 0.41709451 1.84699802 0.17552991
[8] -1.24288775 0.01882849 -1.45396199
```
**%mapFns%**</br>
*invoke_map*</br>
%Xtimes%</br>
# List Sequence Formula Customize</br>
formulatoList.</br>
%from%</br>
# Getter </br>
%getCol% %getRow% %getCol.% %getRow.%</br>
%getElem% %getElem2% %getElems%</br>
# Icor</br>
icor</br>
icor.corrToStudent</br>
icor.critical.r</br>
icor.studentToCorr</br>
icor.graph</br>
# Lists</br>
## LISTS OPS
*%#1,#2%*</br>
* #1 must be constructed with _ and .*</br>
* if you want that the left side must be interprete with "l_", you have to write _ for the left (#1)%</br>
* *1 = _ *</br>
* if you want #2 be normal like "l", just write nothing for #1 *</br>
* #1 = _ *</br>
* #2 = *</br>
* Operator = %_,%*</br>
```R
> rnorm(3) %_,% rnorm(3) #SAME AS l( l1_(rnorm(3)), rnorm(3) )
[[1]]
<icor_list>
function (..., .x = ..1, .y = ..2, . = ..1)
rnorm(., 3)
[[2]]
[1] 0.2080809 1.2826301 -0.4169875
```
* if you want you can change the #2, with "__" for interprete the right side with "l__"*</br>
```R
> rnorm(3) %_,__% rnorm(3) #SAME AS l( l1_(rnorm(3)), l1__(rnorm(3)) )
[[1]]
<icor_list>
function (..., .x = ..1, .y = ..2, . = ..1)
rnorm(., 3)
[[2]]
<icor_list>
function (..., .x = ..1, .y = ..2, . = ..1)
rnorm(3)
```
**l l. lx ln lx. ln. %,% %.,.% %.,% %,.% **</br>
*normal list but understand .()*</br>
```R
> i = 3
> l(.(i),4) #SAME .(i) %,% 4
[[1]]
[1] 3
[[2]]
[1] 4
> l.(.(i),4) #SAME .(i) %.,% 4
Error in .(i) : impossible de trouver la fonction "."
ll normal list but nested list(list()) l_ lx_ ln_ l1_ %,% %,% %,% %__,% %___,% AND symetrics normal list but for each parameters return a function | l1_ return the first one | %,% a parameter: function, formula ```R
l_( rnorm(1), ~rnorm(4), { rnorm(mean=4)}, rnorm ) #SAME rnorm(1) %,% (~rnorm(4)) %,% { rnorm(mean=4) } %,% rnorm [[1]] function (..., .x = ..1, .y = ..2, . = ..1) rnorm(., 1)
[[2]] function (..., .x = ..1, .y = ..2, . = ..1) rnorm(4)
[[3]] function (..., .x = ..1, .y = ..2, . = ..1) { rnorm(mean = 4) }
[[4]] function (..., .x = ..1, .y = ..2, . = ..1) rnorm(.)
l1_( rnorm(1), ~rnorm(4), { rnorm(mean=4) }, rnorm ) # SAME AS rnorm(1) %,% (~rnorm(4)) %,% { rnorm(mean=4) } %,% rnorm %...>% l1 function (..., .x = ..1, .y = ..2, . = ..1) rnorm(., 1)
3 %,_% rnorm(1) [[1]] [1] 3
[[2]] function (..., .x = ..1, .y = ..2, . = ..1) rnorm(., 1)
``` l__ %__,__% %__,_% %__,% AND symetrics l___ %listToDotsFn_% %listToDotsFn% # StrCls StrCls ?? lapplys ?? # Tests test_normal test_same_distrib # Future (HenrikBengtsson/future) %future% //e= d %>% girafe(ggobj = .) %>% girafe_options(opts_hover(css = "fill:red;r:4pt;"))
R Package Documentation
Browse R Packages
We want your feedback!
Note that we can't provide technical support on individual packages. You should contact the package authors for that.
Embedding an R snippet on your website
Add the following code to your website.
For more information on customizing the embed code, read Embedding Snippets.