readme.md
In mjfii/Local-Extrema: Calculate and Visualize Local Extrema
Calculate and Plot Local Extrema
This R package, local.extrema, consumes a numeric vector and derives the local extrema, or the peaks and valleys, for that vector. Additionally, there is plotting capabilities to visualize the amplitude between minima and maxima.
Overview
The library contains two primary (usable) functions and a single set of demo data:
1. extrema: This function generates an S3 class, and accepts two arguments:
1. x: the numeric vector that will used in the calculation.
2. interval: the interval at which the extrema is calculated, i.e. how many observations. are considered before the next extrema can be considered.
2. plot_extrema:
1. x: the S3 class generated by the extrema function.
2. ordinal_count: an integer vector of the number of observations to visualize on the plot, i.e. if the vector length is 1M, you might only want to visualize 100. A single length vector, when positive, will be interpreted as the first n values; when negative, will be interpreted as the last n values. A double length vector will be interpreted as the start and end element ordinals in the vector - this arguement is not quite ready, sorry. :(
3. slv: This is the preloaded demo data based on 100 days of stock ticker "SLV", the actual time frame is irrelevant.
Motivation
Too many times there was a need to determine peaks and valleys when working with time-series data. There were a couple libraries out there that did some, but not all of the work, and they were cumbersome to use. Alternately, there were some libraries that tried to smooth the data in a way that never truly isolated a true extrema from the input vector. This library works with simple vector inputs, and derives simple usable objects it integrate.
Prerequisites
The library requires only one additional package, ggplot2, which is installed when this library is loaded. While the package is not necessary to calculate the local extrema, it generates a plot that can be generated is quite helpful in understanding the data.
Installation
In order to install, make sure you have the devtools library installed. Then, using the install_github function, install with the below:
install_github('mjfii/Local-Extrema')
library('local.extrema')
Examples and Library Data
To inspect the demo data:
x <- slv
x
# or
slv[1:25]
To calculate:
x <- extrema(slv, 3)
print(x)
class : local.extrema
interval :  int 3
maxima :  int [1:6] 2 22 26 33 69 85
minima :  int [1:8] 11 23 30 50 57 66 80 91
results : 'data.frame': 100 obs. of  4 variables:
 $ x        : int  1 2 3 4 5 6 7 8 9 10 ...
 $ y        : num  17.4 17.4 16.8 17 16.8 ...
 $ is_maxima: logi  FALSE TRUE FALSE FALSE FALSE FALSE ...
 $ is_minima: logi  FALSE FALSE FALSE FALSE FALSE FALSE ...
To view the contents of the S3 class:
x$interval
x$maxima
x$minima
x$results
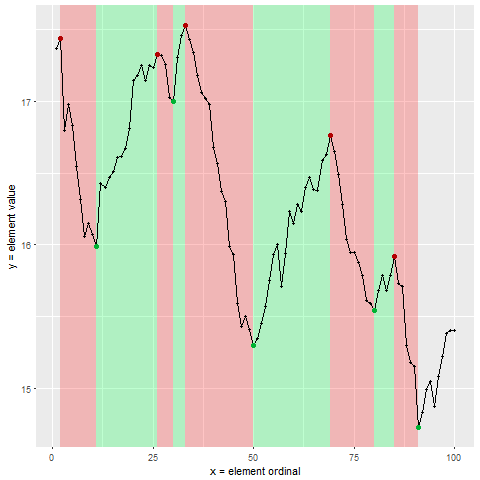
To plot:
x <- extrema(slv, 5)
plot_extrema(x)
Contributors
Michael Flanigan
email: mick.flanigan@gmail.com
twitter: @mjfii
Versioning
0.0.1.9000 - Initial deployment (2017-08-11)
mjfii/Local-Extrema documentation built on May 24, 2019, 2:07 a.m.
R Package Documentation
Browse R Packages
We want your feedback!
Note that we can't provide technical support on individual packages. You should contact the package authors for that.
Calculate and Plot Local Extrema
This R package, local.extrema, consumes a numeric vector and derives the local extrema, or the peaks and valleys, for that vector. Additionally, there is plotting capabilities to visualize the amplitude between minima and maxima.
Overview
The library contains two primary (usable) functions and a single set of demo data:
1. extrema: This function generates an S3 class, and accepts two arguments:
1. x: the numeric vector that will used in the calculation.
2. interval: the interval at which the extrema is calculated, i.e. how many observations. are considered before the next extrema can be considered.
2. plot_extrema:
1. x: the S3 class generated by the extrema function.
2. ordinal_count: an integer vector of the number of observations to visualize on the plot, i.e. if the vector length is 1M, you might only want to visualize 100. A single length vector, when positive, will be interpreted as the first n values; when negative, will be interpreted as the last n values. A double length vector will be interpreted as the start and end element ordinals in the vector - this arguement is not quite ready, sorry. :(
3. slv: This is the preloaded demo data based on 100 days of stock ticker "SLV", the actual time frame is irrelevant.
Motivation
Too many times there was a need to determine peaks and valleys when working with time-series data. There were a couple libraries out there that did some, but not all of the work, and they were cumbersome to use. Alternately, there were some libraries that tried to smooth the data in a way that never truly isolated a true extrema from the input vector. This library works with simple vector inputs, and derives simple usable objects it integrate.
Prerequisites
The library requires only one additional package, ggplot2, which is installed when this library is loaded. While the package is not necessary to calculate the local extrema, it generates a plot that can be generated is quite helpful in understanding the data.
Installation
In order to install, make sure you have the devtools library installed. Then, using the install_github function, install with the below:
install_github('mjfii/Local-Extrema')
library('local.extrema')
Examples and Library Data
To inspect the demo data:
x <- slv
x
# or
slv[1:25]
To calculate:
x <- extrema(slv, 3)
print(x)
class : local.extrema
interval : int 3
maxima : int [1:6] 2 22 26 33 69 85
minima : int [1:8] 11 23 30 50 57 66 80 91
results : 'data.frame': 100 obs. of 4 variables:
$ x : int 1 2 3 4 5 6 7 8 9 10 ...
$ y : num 17.4 17.4 16.8 17 16.8 ...
$ is_maxima: logi FALSE TRUE FALSE FALSE FALSE FALSE ...
$ is_minima: logi FALSE FALSE FALSE FALSE FALSE FALSE ...
To view the contents of the S3 class:
x$interval
x$maxima
x$minima
x$results
To plot:
x <- extrema(slv, 5)
plot_extrema(x)
Contributors
Michael Flanigan email: mick.flanigan@gmail.com twitter: @mjfii
Versioning
0.0.1.9000 - Initial deployment (2017-08-11)
R Package Documentation
Browse R Packages
We want your feedback!
Note that we can't provide technical support on individual packages. You should contact the package authors for that.
Embedding an R snippet on your website
Add the following code to your website.
For more information on customizing the embed code, read Embedding Snippets.