README.md
In ndphillips/iwillsurvive: Easily Create and Visualize Survival Models
iwillsurvive 0.1.5.9000 


The goal of iwillsurvive is to make it easy to estimate and visualize
simple survival models. It does this by providing an intuitive
functional interface and user-friendly in-line messages, notes, and
warnings, while leveraging the gold-standard survival package for all
statistical methods.
Installation
iwillsurvive is hosted at
https://github.com/ndphillips/iwillsurvive. Here is how to install it:
devtools::install_github(
  repo = "https://github.com/ndphillips/iwillsurvive",
  build_vignettes = TRUE
)
Example
library(iwillsurvive)
library(dplyr)
I’ll now give a very brief overview of the basic survival model that
iwillsurvive works with. For a more thorough and informative
discussion, check out Emily C. Zabor’s Survival Analysis in
R.
It’s awesome.
Raw data
We’ll start with the cohort_raw dataset which represents the results
of a (fictional) clinical trial testing the effectiveness of a drug in
extending survival from a patient’s first line of therapy start date.
Here are the first 8 patients:
| patientid | sex | age | condition | lotstartdate | lastvisitdate | dateofdeath |
|:----------|:----|-----:|:----------|:-------------|:--------------|:------------|
| F00001 | m | 41.8 | placebo | 2016-05-17 | 2020-12-01 | NA |
| F00002 | m | 45.3 | placebo | 2020-07-27 | 2020-08-25 | 2020-10-05 |
| F00003 | m | 52.9 | drug | 2016-04-14 | 2017-02-16 | 2017-03-13 |
| F00004 | m | 48.4 | drug | 2020-06-12 | 2020-11-25 | NA |
| F00005 | f | 54.4 | placebo | 2019-03-20 | 2020-01-13 | 2020-02-21 |
| F00006 | f | 50.7 | placebo | 2017-04-02 | 2017-10-18 | 2017-11-19 |
| F00007 | f | 47.6 | placebo | 2018-01-26 | 2019-01-12 | 2019-02-17 |
| F00008 | f | 42.7 | placebo | 2015-07-02 | 2015-11-20 | 2015-12-23 |
Here’s what the key columns mean:
| Column | Definition |
|:----------------|:------------------------------------------------------------------------------------------------------------------------|
| patientid | A character referring to an individual patient in the form “FXXXXX” |
| condition | A character indicating which condition the patient was in, unique values are: placebo, drug |
| lotstartdate | A date indicating when a patient started their first line of therapy after diagnosis (will be used as the index date) |
| lastvisitdate | A date indicating the last known date that a patient was alive (will be used as the censor date) |
| dateofdeath | A date indicating the date of death of patients who died during the study period (will be used as the event date) |
Research Question
Below is our main research question:
What is the difference in median survival from lot1start to death (or
censor) for patients in the placebo versus drug condition?
Survival data
Before we can estimate the survival model, we need to define some key
columns:
| Variable | Definition |
|:----------------|:---------------------------------------------------------------------------------------------------------|
| followup_date | The date at which the event occurs (if known), otherwise the last date the patient was known to be alive |
| followup_days | The number of days from indexdate to followupdate |
| eventstatus | A logical column indicating whether or not the patient died. TRUE = Yes, FALSE = No. |
To calculate these variables, we can use iwillsurvive’s derive
functions: Use the derive_*() functions to calculate key derived
columns:
followup_date: dateofdeath, if known, and censordate, otherwisefollowup_days: Days from index_date (in our case, lotstartdate)
to followup_dateevent_status: A logical column indicating whether or not the event
(dateofdeath) is known.
cohort <- cohort_raw %>%
  derive_followup_date(
    event_date = "dateofdeath",
    censor_date = "lastvisitdate"
  ) %>%
  derive_followup_time(index_date = "lotstartdate") %>%
  derive_event_status(event_date = "dateofdeath")
Here’s how the new columns look for the first 8 patients:
| patientid | followup_date | followup_days | event_status |
|:----------|:--------------|--------------:|:-------------|
| F00001 | 2020-12-01 | 1659.93708 | FALSE |
| F00002 | 2020-10-05 | 70.10455 | TRUE |
| F00003 | 2017-03-13 | 333.35423 | TRUE |
| F00004 | 2020-11-25 | 166.74057 | FALSE |
| F00005 | 2020-02-21 | 338.18433 | TRUE |
| F00006 | 2017-11-19 | 231.78657 | TRUE |
| F00007 | 2019-02-17 | 387.86797 | TRUE |
| F00008 | 2015-12-23 | 174.93504 | TRUE |
Fitting survival models
Use iwillsurvive() to fit the survival model. We’ll set the follow up
time to be followup_days and specify “condition” as a term (i.e.;
covariate) to be used in the model.
cohort_iws <- iwillsurvive(cohort,
  followup_time = "followup_days",
  terms = "condition",
  event_title = "Death",
  index_title = "LOT1 Start"
)
#> ── iwillsurvive ────────────────────────────────────────────────────────────────
#> - 202 of 250 (81%) patient(s) experienced the event.
#> - survival::survfit(survival::Surv(followup_days, event_status, type = 'right') ~ condition, data = data)
print method
Print the object to see summary information:
cohort_iws
Plotting followup times
Use plot_followup() to visualize the observed follow-up times for each
patient ordered by the length of their follow-up and colored by their
event status (not by condition)
plot_followup(cohort_iws)

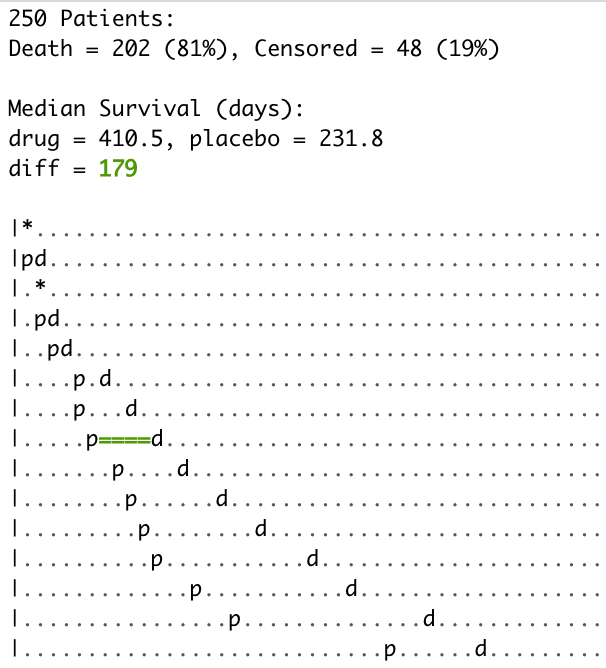
Plotting Kaplan-Meier curves (the plot method)
Use plot() to plot the Kaplan-Meier survival curve. If you don’t
include any arguments, you’ll get the ‘default’ curve options.
plot(cohort_iws)

You can fully customize the look of your Kaplan-Meier curve (see
?plot.iwillsurvive) to see all the optional arguments:
plot(cohort_iws,
  add_confidence = FALSE,
  add_median_delta = FALSE,
  censor_pch = 3,
  censor_size = 5,
  legend_position_x = c(600, 400),
  legend_nudge_y = c(.25, .3),
  median_flag_nudge_y = .15,
  anchor_arrow = TRUE,
  palette = "Dark2",
  title = "My Title",
  subtitle = "My Subttitle",
  risk_table_title = "My Risk Table Title"
)

Understanding iwillsurvive objects
The iwillsurvive() function returns an object of class iwillsurvive.
Internally, it is a list containing many objects from the original data,
to a survival object:
names(cohort_iws)
#>  [1] "data"                "fit"                 "fit_summary"
#>  [4] "terms"               "event_title"         "index_title"
#>  [7] "followup_time_col"   "followup_time_units" "timeatrisk_col"
#> [10] "event_status_col"    "patientid_col"       "title"
The .$data object contains the original data
cohort_iws$data
#> # A tibble: 250 × 10
#>    patientid sex     age condition lotstartdate lastvisitdate dateofdeath
#>    <chr>     <chr> <dbl> <chr>     <date>       <date>        <date>
#>  1 F00001    m      41.8 placebo   2016-05-17   2020-12-01    NA
#>  2 F00002    m      45.3 placebo   2020-07-27   2020-08-25    2020-10-05
#>  3 F00003    m      52.9 drug      2016-04-14   2017-02-16    2017-03-13
#>  4 F00004    m      48.4 drug      2020-06-12   2020-11-25    NA
#>  5 F00005    f      54.4 placebo   2019-03-20   2020-01-13    2020-02-21
#>  6 F00006    f      50.7 placebo   2017-04-02   2017-10-18    2017-11-19
#>  7 F00007    f      47.6 placebo   2018-01-26   2019-01-12    2019-02-17
#>  8 F00008    f      42.7 placebo   2015-07-02   2015-11-20    2015-12-23
#>  9 F00009    m      48.1 drug      2019-03-08   2020-07-18    2020-08-17
#> 10 F00010    m      28.9 placebo   2018-08-23   2019-02-14    2019-03-08
#> # ℹ 240 more rows
#> # ℹ 3 more variables: followup_date <date>, followup_days <dbl>,
#> #   event_status <lgl>
The .$fit object contains the survival object (created using the
survival::survfit() function)
cohort_iws$fit
#> Call: survfit(formula = survival::Surv(followup_days, event_status,
#>     type = "right") ~ condition, data = data)
#>
#>                     n events median 0.95LCL 0.95UCL
#> condition=drug    132    105    410     329     590
#> condition=placebo 118     97    232     184     313
The .$fit_summary object contains summary information:
cohort_iws$fit_summary
#> # A tibble: 2 × 10
#>   strata         records n.max n.start events rmean `se(rmean)` median `0.95LCL`
#>   <chr>            <dbl> <dbl>   <dbl>  <dbl> <dbl>       <dbl>  <dbl>     <dbl>
#> 1 condition=drug     132   132     132    105  542.        40.9   410.      329.
#> 2 condition=pla…     118   118     118     97  349.        39.4   232.      184.
#> # ℹ 1 more variable: `0.95UCL` <dbl>
iwillsurvive and the survival package
iwillsurvive uses the survival package under the hood for all model
estimation. For that reason, you should always be able to get the ‘same
result’ using the survival package as you would using the
iwillsurvive package.
For example, here’s how to directly replicate the same result we got
using survival:
library(survival)

# Fit the model
fit_survival <- survival::survfit(
  survival::Surv(followup_days, event_status,
    type = "right"
  ) ~ condition,
  data = cohort
)

# Print method
fit_survival
#> Call: survfit(formula = survival::Surv(followup_days, event_status,
#>     type = "right") ~ condition, data = cohort)
#>
#>                     n events median 0.95LCL 0.95UCL
#> condition=drug    132    105    410     329     590
#> condition=placebo 118     97    232     184     313
ndphillips/iwillsurvive documentation built on June 4, 2024, 3 p.m.
R Package Documentation
Browse R Packages
We want your feedback!
Note that we can't provide technical support on individual packages. You should contact the package authors for that.
iwillsurvive 0.1.5.9000
![]()
![]()
![]()
![]()
The goal of iwillsurvive is to make it easy to estimate and visualize
simple survival models. It does this by providing an intuitive
functional interface and user-friendly in-line messages, notes, and
warnings, while leveraging the gold-standard survival package for all
statistical methods.
Installation
iwillsurvive is hosted at
https://github.com/ndphillips/iwillsurvive. Here is how to install it:
devtools::install_github(
repo = "https://github.com/ndphillips/iwillsurvive",
build_vignettes = TRUE
)
Example
library(iwillsurvive)
library(dplyr)
I’ll now give a very brief overview of the basic survival model that
iwillsurvive works with. For a more thorough and informative
discussion, check out Emily C. Zabor’s Survival Analysis in
R.
It’s awesome.
Raw data
We’ll start with the cohort_raw dataset which represents the results
of a (fictional) clinical trial testing the effectiveness of a drug in
extending survival from a patient’s first line of therapy start date.
Here are the first 8 patients:
| patientid | sex | age | condition | lotstartdate | lastvisitdate | dateofdeath | |:----------|:----|-----:|:----------|:-------------|:--------------|:------------| | F00001 | m | 41.8 | placebo | 2016-05-17 | 2020-12-01 | NA | | F00002 | m | 45.3 | placebo | 2020-07-27 | 2020-08-25 | 2020-10-05 | | F00003 | m | 52.9 | drug | 2016-04-14 | 2017-02-16 | 2017-03-13 | | F00004 | m | 48.4 | drug | 2020-06-12 | 2020-11-25 | NA | | F00005 | f | 54.4 | placebo | 2019-03-20 | 2020-01-13 | 2020-02-21 | | F00006 | f | 50.7 | placebo | 2017-04-02 | 2017-10-18 | 2017-11-19 | | F00007 | f | 47.6 | placebo | 2018-01-26 | 2019-01-12 | 2019-02-17 | | F00008 | f | 42.7 | placebo | 2015-07-02 | 2015-11-20 | 2015-12-23 |
Here’s what the key columns mean:
| Column | Definition |
|:----------------|:------------------------------------------------------------------------------------------------------------------------|
| patientid | A character referring to an individual patient in the form “FXXXXX” |
| condition | A character indicating which condition the patient was in, unique values are: placebo, drug |
| lotstartdate | A date indicating when a patient started their first line of therapy after diagnosis (will be used as the index date) |
| lastvisitdate | A date indicating the last known date that a patient was alive (will be used as the censor date) |
| dateofdeath | A date indicating the date of death of patients who died during the study period (will be used as the event date) |
Research Question
Below is our main research question:
What is the difference in median survival from lot1start to death (or censor) for patients in the placebo versus drug condition?
Survival data
Before we can estimate the survival model, we need to define some key columns:
| Variable | Definition |
|:----------------|:---------------------------------------------------------------------------------------------------------|
| followup_date | The date at which the event occurs (if known), otherwise the last date the patient was known to be alive |
| followup_days | The number of days from indexdate to followupdate |
| eventstatus | A logical column indicating whether or not the patient died. TRUE = Yes, FALSE = No. |
To calculate these variables, we can use iwillsurvive’s derive
functions: Use the derive_*() functions to calculate key derived
columns:
followup_date:dateofdeath, if known, andcensordate, otherwisefollowup_days: Days fromindex_date(in our case,lotstartdate) tofollowup_dateevent_status: A logical column indicating whether or not the event (dateofdeath) is known.
cohort <- cohort_raw %>%
derive_followup_date(
event_date = "dateofdeath",
censor_date = "lastvisitdate"
) %>%
derive_followup_time(index_date = "lotstartdate") %>%
derive_event_status(event_date = "dateofdeath")
Here’s how the new columns look for the first 8 patients:
| patientid | followup_date | followup_days | event_status | |:----------|:--------------|--------------:|:-------------| | F00001 | 2020-12-01 | 1659.93708 | FALSE | | F00002 | 2020-10-05 | 70.10455 | TRUE | | F00003 | 2017-03-13 | 333.35423 | TRUE | | F00004 | 2020-11-25 | 166.74057 | FALSE | | F00005 | 2020-02-21 | 338.18433 | TRUE | | F00006 | 2017-11-19 | 231.78657 | TRUE | | F00007 | 2019-02-17 | 387.86797 | TRUE | | F00008 | 2015-12-23 | 174.93504 | TRUE |
Fitting survival models
Use iwillsurvive() to fit the survival model. We’ll set the follow up
time to be followup_days and specify “condition” as a term (i.e.;
covariate) to be used in the model.
cohort_iws <- iwillsurvive(cohort,
followup_time = "followup_days",
terms = "condition",
event_title = "Death",
index_title = "LOT1 Start"
)
#> ── iwillsurvive ────────────────────────────────────────────────────────────────
#> - 202 of 250 (81%) patient(s) experienced the event.
#> - survival::survfit(survival::Surv(followup_days, event_status, type = 'right') ~ condition, data = data)
print method
Print the object to see summary information:
cohort_iws
Plotting followup times
Use plot_followup() to visualize the observed follow-up times for each
patient ordered by the length of their follow-up and colored by their
event status (not by condition)
plot_followup(cohort_iws)
Plotting Kaplan-Meier curves (the plot method)
Use plot() to plot the Kaplan-Meier survival curve. If you don’t
include any arguments, you’ll get the ‘default’ curve options.
plot(cohort_iws)
You can fully customize the look of your Kaplan-Meier curve (see
?plot.iwillsurvive) to see all the optional arguments:
plot(cohort_iws,
add_confidence = FALSE,
add_median_delta = FALSE,
censor_pch = 3,
censor_size = 5,
legend_position_x = c(600, 400),
legend_nudge_y = c(.25, .3),
median_flag_nudge_y = .15,
anchor_arrow = TRUE,
palette = "Dark2",
title = "My Title",
subtitle = "My Subttitle",
risk_table_title = "My Risk Table Title"
)
Understanding iwillsurvive objects
The iwillsurvive() function returns an object of class iwillsurvive.
Internally, it is a list containing many objects from the original data,
to a survival object:
names(cohort_iws)
#> [1] "data" "fit" "fit_summary"
#> [4] "terms" "event_title" "index_title"
#> [7] "followup_time_col" "followup_time_units" "timeatrisk_col"
#> [10] "event_status_col" "patientid_col" "title"
The .$data object contains the original data
cohort_iws$data
#> # A tibble: 250 × 10
#> patientid sex age condition lotstartdate lastvisitdate dateofdeath
#> <chr> <chr> <dbl> <chr> <date> <date> <date>
#> 1 F00001 m 41.8 placebo 2016-05-17 2020-12-01 NA
#> 2 F00002 m 45.3 placebo 2020-07-27 2020-08-25 2020-10-05
#> 3 F00003 m 52.9 drug 2016-04-14 2017-02-16 2017-03-13
#> 4 F00004 m 48.4 drug 2020-06-12 2020-11-25 NA
#> 5 F00005 f 54.4 placebo 2019-03-20 2020-01-13 2020-02-21
#> 6 F00006 f 50.7 placebo 2017-04-02 2017-10-18 2017-11-19
#> 7 F00007 f 47.6 placebo 2018-01-26 2019-01-12 2019-02-17
#> 8 F00008 f 42.7 placebo 2015-07-02 2015-11-20 2015-12-23
#> 9 F00009 m 48.1 drug 2019-03-08 2020-07-18 2020-08-17
#> 10 F00010 m 28.9 placebo 2018-08-23 2019-02-14 2019-03-08
#> # ℹ 240 more rows
#> # ℹ 3 more variables: followup_date <date>, followup_days <dbl>,
#> # event_status <lgl>
The .$fit object contains the survival object (created using the
survival::survfit() function)
cohort_iws$fit
#> Call: survfit(formula = survival::Surv(followup_days, event_status,
#> type = "right") ~ condition, data = data)
#>
#> n events median 0.95LCL 0.95UCL
#> condition=drug 132 105 410 329 590
#> condition=placebo 118 97 232 184 313
The .$fit_summary object contains summary information:
cohort_iws$fit_summary
#> # A tibble: 2 × 10
#> strata records n.max n.start events rmean `se(rmean)` median `0.95LCL`
#> <chr> <dbl> <dbl> <dbl> <dbl> <dbl> <dbl> <dbl> <dbl>
#> 1 condition=drug 132 132 132 105 542. 40.9 410. 329.
#> 2 condition=pla… 118 118 118 97 349. 39.4 232. 184.
#> # ℹ 1 more variable: `0.95UCL` <dbl>
iwillsurvive and the survival package
iwillsurvive uses the survival package under the hood for all model
estimation. For that reason, you should always be able to get the ‘same
result’ using the survival package as you would using the
iwillsurvive package.
For example, here’s how to directly replicate the same result we got
using survival:
library(survival)
# Fit the model
fit_survival <- survival::survfit(
survival::Surv(followup_days, event_status,
type = "right"
) ~ condition,
data = cohort
)
# Print method
fit_survival
#> Call: survfit(formula = survival::Surv(followup_days, event_status,
#> type = "right") ~ condition, data = cohort)
#>
#> n events median 0.95LCL 0.95UCL
#> condition=drug 132 105 410 329 590
#> condition=placebo 118 97 232 184 313
R Package Documentation
Browse R Packages
We want your feedback!
Note that we can't provide technical support on individual packages. You should contact the package authors for that.
Embedding an R snippet on your website
Add the following code to your website.
For more information on customizing the embed code, read Embedding Snippets.