In nguyens7/tidyNano: A framework to Tidy and Analyze Nanoparticle Data
knitr::opts_chunk$set(
  collapse = TRUE,
  comment = "#>",
  fig.path = "man/figures/"
)
tidyNano 
tidyNano is an R package that imports raw NanoSight data and provides a framework to clean, analyze, and visualize nanoparticle analysis data. You can browse the source code on GitHub.
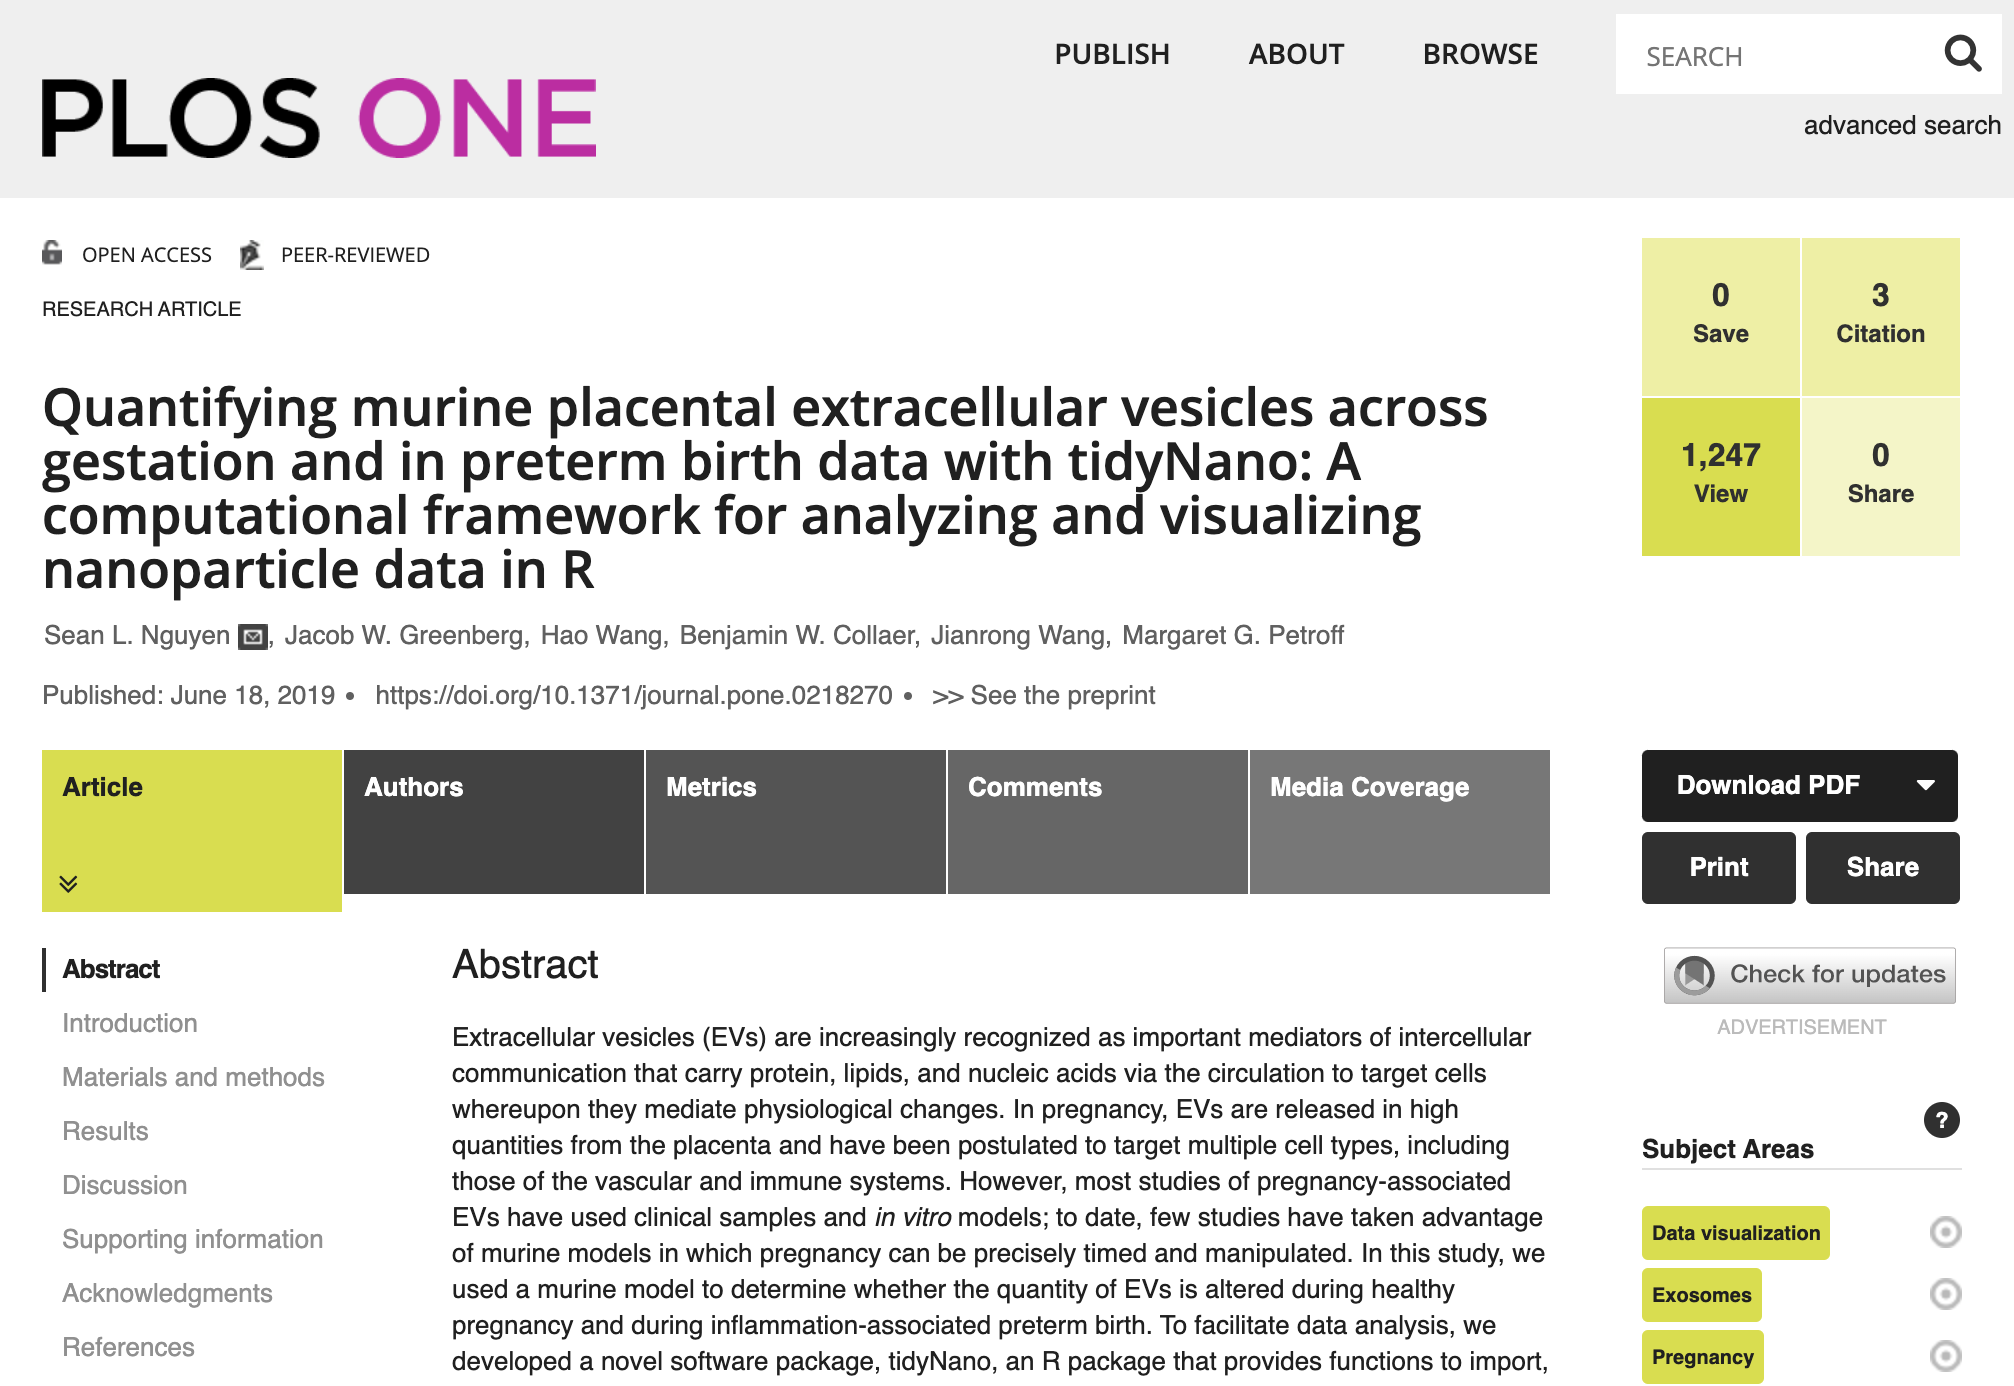
Check out our manuscript in PLOS ONE!
A representative video of NTA data of murine plasma exosomes from our paper.
News (7/2020)
Added more reprexes in the README to assist in importing data.
Fixed custom_name argument in nanoimport() function and nanocombine() function.
nanoimport() has just been updated to be more flexible and works with NTA versions 3.0 - 3.4! The function should be able to detect and import your data.
nanolyze() and nanocount() both will ungroup data.
Nomenclature
We recommend naming your files in snake_case so it's conducive for processing with the nanotidy() function. With each sample we recommend adding important information so you can parse it out during analysis, be sure to influde the dilution value in the sample name if you do not enter it during the dilution entry box during acquisition. For example you can name your files using the general formula SampleID_Treatment_1500_. Be sure to leave a _ at the end so the NTA software will append your files with a numerical count (00,01,02...) which will serve as way to track your technical replicates.
If you already collected you data and don't have your dilution in your sample name you can simply add the dilution when you use nanoimport(). Simply add the dilution value in the custom_name argument. If you did label your samples and enter in the dilution in the NTA software during acquisition you can make auto_name == TRUE in nanoimport().
Overview
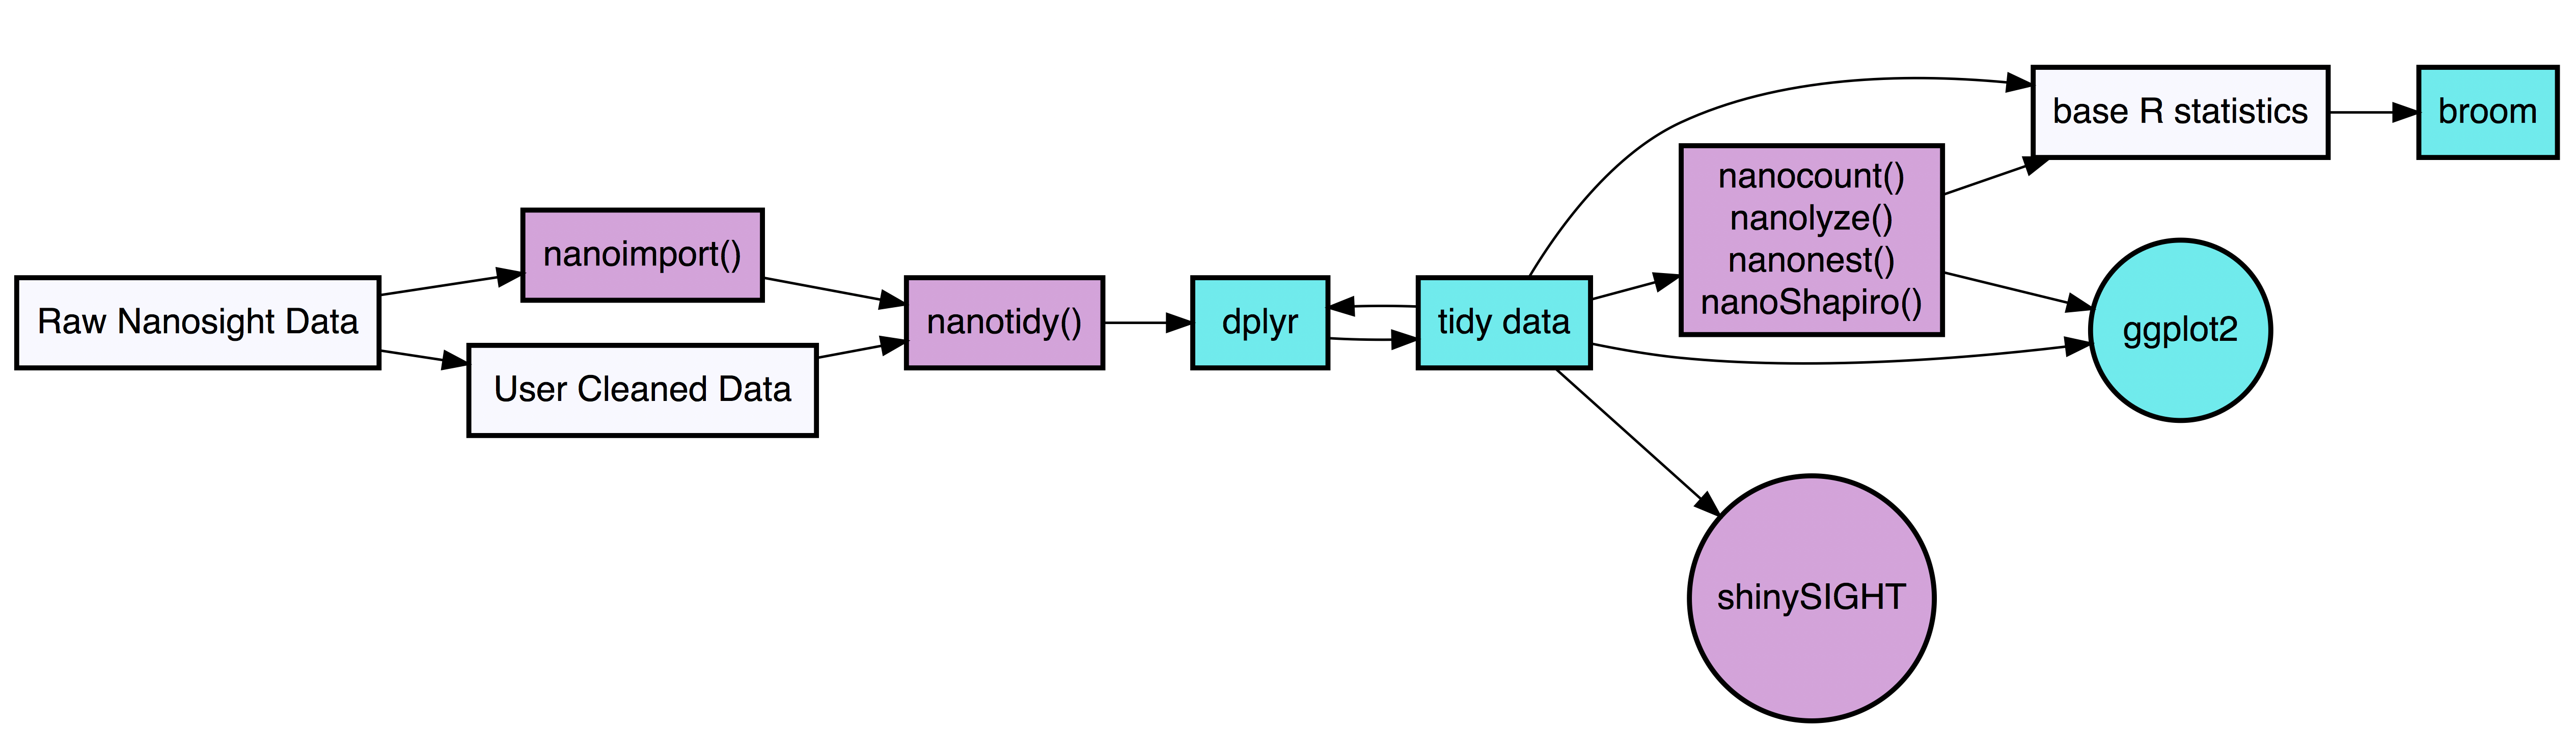
tidyNano functions (Purple) allow for easily extracting and converting raw NTA count data into a tidy dataframe that is suitable for analysis using dplyr and ggplot2. tidyNano also provides a interactive shiny application (shinySIGHT) for visualizing data.
tidyNano also includes a Shiny app named shinySIGHT for interactive visualization of NTA data.
Installation
The latest development version can be installed from github:
# install.packages("devtools")

# devtools::install_github("nguyens7/tidyNano")
tidyNano Example
library(tidyNano)
library(tidyverse)

file <- system.file("extdata", "beads.csv", package = "tidyNano")

data <- nanoimport(file)

head(data)
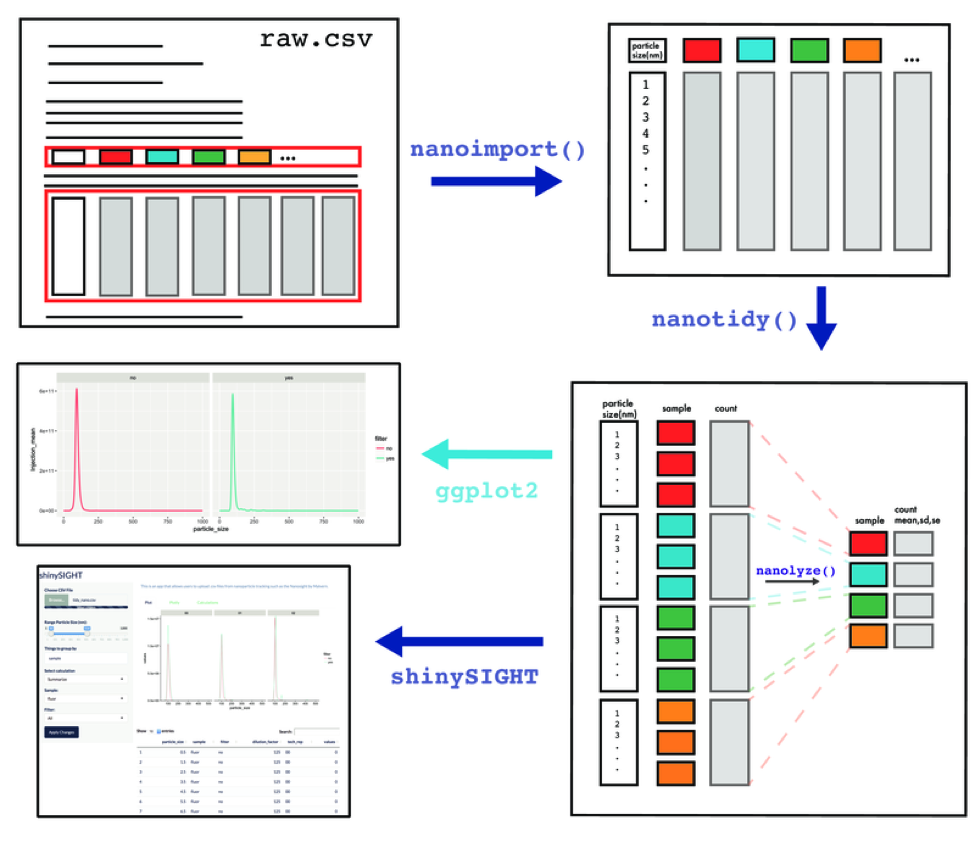
nanoimport is a function that extracts the particle data from raw a nanosight .csv file and creates a dataframe that is suitable for cleaning within R. Note: This assumes you added the dilution factor when you named your samples during acquistion.
data <- nanoimport(file)

head(data)
nanoimport without dilution factor in the sample name
If you didn't include your dilution factor in the sample name you can use the argument auto_name == TRUE within the nanoimport() function.
file2 <- system.file("extdata", "beads2.csv", package = "tidyNano")

data2 <- nanoimport(file2, auto_name = TRUE)

head(data2)
You can even add a custom name to append extra information to your sample columns using the custom_name() argument.
custom_name_data2 <- nanoimport(file2, auto_name = TRUE, custom_name = "YourLabelHere")

head(custom_name_data2)
tidy_data <- data  %>%
  nanotidy(sep_var = c("Sample", "Dilution","Filter","Injection","Tech_rep"))

head(tidy_data)
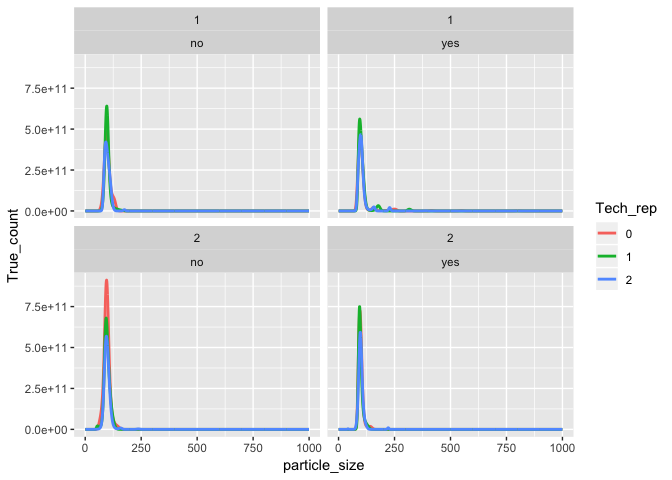
tidy_data %>%
  ggplot(aes(x = particle_size, y = True_count, color = Tech_rep)) +
  geom_line(size = 1) +
  facet_wrap(Injection ~ Filter)
nguyens7/tidyNano documentation built on Feb. 27, 2021, 4:14 p.m.
R Package Documentation
Browse R Packages
We want your feedback!
Note that we can't provide technical support on individual packages. You should contact the package authors for that.
knitr::opts_chunk$set( collapse = TRUE, comment = "#>", fig.path = "man/figures/" )
tidyNano
tidyNano is an R package that imports raw NanoSight data and provides a framework to clean, analyze, and visualize nanoparticle analysis data. You can browse the source code on GitHub.
Check out our manuscript in PLOS ONE!
A representative video of NTA data of murine plasma exosomes from our paper.
News (7/2020)
Added more reprexes in the README to assist in importing data.
Fixed custom_name argument in nanoimport() function and nanocombine() function.
nanoimport() has just been updated to be more flexible and works with NTA versions 3.0 - 3.4! The function should be able to detect and import your data.
nanolyze() and nanocount() both will ungroup data.
Nomenclature
We recommend naming your files in snake_case so it's conducive for processing with the nanotidy() function. With each sample we recommend adding important information so you can parse it out during analysis, be sure to influde the dilution value in the sample name if you do not enter it during the dilution entry box during acquisition. For example you can name your files using the general formula SampleID_Treatment_1500_. Be sure to leave a _ at the end so the NTA software will append your files with a numerical count (00,01,02...) which will serve as way to track your technical replicates.
If you already collected you data and don't have your dilution in your sample name you can simply add the dilution when you use nanoimport(). Simply add the dilution value in the custom_name argument. If you did label your samples and enter in the dilution in the NTA software during acquisition you can make auto_name == TRUE in nanoimport().
Overview
tidyNano functions (Purple) allow for easily extracting and converting raw NTA count data into a tidy dataframe that is suitable for analysis using dplyr and ggplot2. tidyNano also provides a interactive shiny application (shinySIGHT) for visualizing data.
tidyNano also includes a Shiny app named shinySIGHT for interactive visualization of NTA data.
Installation
The latest development version can be installed from github:
# install.packages("devtools") # devtools::install_github("nguyens7/tidyNano")
tidyNano Example
library(tidyNano) library(tidyverse) file <- system.file("extdata", "beads.csv", package = "tidyNano") data <- nanoimport(file) head(data)
nanoimport is a function that extracts the particle data from raw a nanosight .csv file and creates a dataframe that is suitable for cleaning within R. Note: This assumes you added the dilution factor when you named your samples during acquistion.
data <- nanoimport(file) head(data)
nanoimport without dilution factor in the sample name
If you didn't include your dilution factor in the sample name you can use the argument auto_name == TRUE within the nanoimport() function.
file2 <- system.file("extdata", "beads2.csv", package = "tidyNano") data2 <- nanoimport(file2, auto_name = TRUE) head(data2)
You can even add a custom name to append extra information to your sample columns using the custom_name() argument.
custom_name_data2 <- nanoimport(file2, auto_name = TRUE, custom_name = "YourLabelHere") head(custom_name_data2)
tidy_data <- data %>% nanotidy(sep_var = c("Sample", "Dilution","Filter","Injection","Tech_rep")) head(tidy_data)
tidy_data %>% ggplot(aes(x = particle_size, y = True_count, color = Tech_rep)) + geom_line(size = 1) + facet_wrap(Injection ~ Filter)
R Package Documentation
Browse R Packages
We want your feedback!
Note that we can't provide technical support on individual packages. You should contact the package authors for that.
Embedding an R snippet on your website
Add the following code to your website.
For more information on customizing the embed code, read Embedding Snippets.