README.md
In nitesh-1507/WindPlus: Covariates matching and performance quantification
WindPlus Package
Introduction
The package aims at unveiling a unique technique called covariate matching, which takes in different data sets and returns data sets whose feature values exhibit similar characteristics or similar distribution.
Theory
Covariate matching methods are rooted in the statistical literature. In
stabilizing the non-experimental discrepancy between non-treated and treated subjects of observational data, covariate distributions are adjusted by selecting non-treated subjects that have a similar covariate condition as that of treated ones. Through the process of matching, non-treated and treated groups become only randomly different on all background covariates, as if these covariates were designed by experimenters. As a result, the outcomes of the matched non-treated and treated groups, which keep the originally observed values, are comparable under the matched covariate conditions.
1. Definition
Covariate matching is a technique to adjust covariates distribution to make treated and non treated group to have the same covariates condition.
2. Algorithm
Covariate matching is broadly divided into steps : Hierarchial subgrouping and one to one matching.
Hierarchial subrouping - Filters data record in non-treated group which satifies the threshold condition for each data record in treated group.
- Locate a data record in the treated group, Qaft, and label it by the index
j.
- Select one of the covariates, for instance, wind speed, V , and designate
it as the variable of which the similarity between two data records is
computed.
- Go through the data records in the non-treated group, Qbef, by selecting
the subset of data records such that the difference, in terms of the
designated covariate, between the data record j in Qaft and any one of
the records in Qbef is smaller than a pre-specified threshold. When
V is in fact the one designated in Step 2, the resulting subset is then
labeled by placing V as the subscript to Q, namely QV .
- Next, designate another covariate and use it to prune QV in the same
way as one prunes Qbef into QV in Step 3. Doing so produces a smaller
subset nested within QV . Then continue with another covariate until all
covariates are used.
One to One matching - returns the most similar data record after hierarchial sub-grouping
- Select the most similar record from Qbef for each Qaft using mahalanobis distance as the similarity measure.
- Remove the record from Qaft, if a record in Qbef satisfies the above mentioned criteria.
- Repeat the process for each record in Qaft
Installation
The package building relies on certain tool chains in windows and mac respectively, as the compiler for C++ code along with package devtools
Step 1 (Download necessary tool chain):
Tool chain : Rtools - Windows, GFortran - Mac OS
Step 2 (Install package devtools in R):
Install package devtools:
install.packages("devtools")
Step 3 (Build package using devtools):
devtools::install_github("nitesh-1507/WindPlus", build_vignettes = TRUE)

devtools::install_github("nitesh-1507/WindPlus", build_vignettes = FALSE) [Note : only use if above command along with vignette building fails]
Usage
The package can be used to match many different data sets. Broadly two functions are available to match the data sets provided by user.
Loading library
library(WindPlus)
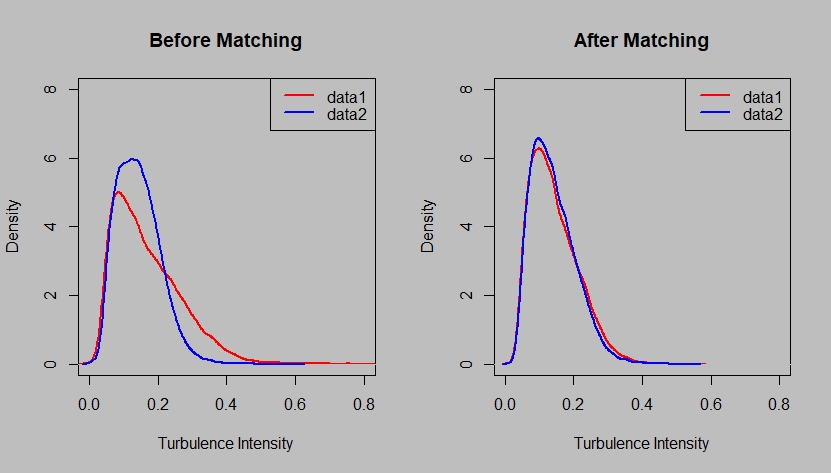
1. Matching binary
The function can be used to match, when the number data sets are two.
# Load library
library(WindPlus)

# Prepare data set for matching
dname = rep(list(), 2)
dname[[1]] = data1
dname[[2]] = data2


# Non circular covariates column
cov = c(6, 1, 13)

# Weight
weight = c(0.1, 0.1, 0.05)

# Matching
matched = covmatch.binary(dname = dname, weight = weight, cov = cov, cov_circ = NULL)

# Commpare result of one covariate with original data
dev.new(width = 550, height = 330, unit = "px")
par(mfrow =  c(1, 2))
par(bg = 'grey')

plot(density(dname[[1]][, 13]), col = 'red', main = 'Before Matching', xlab = 'Turbulence Intensity', lwd = 2, xlim = c(0, 0.8), ylim = c(0, 8))
lines(density(dname[[2]][, 13]), col = 'blue', lwd = 2, ylim = c(0, 8), xlim = c(0, 0.8), ylim = c(0, 8))
legend('topright', legend = c('data1', 'data2'), col=c("red", "blue"), lty=1, lwd = 2)

plot(density(matched[[1]][, 13]), col = 'red', main = 'After Matching', xlab = 'Turbulence Intensity', lwd = 2, xlim = c(0, 0.8), ylim = c(0, 8))
lines(density(matched[[2]][,13]), col = 'blue', lwd = 2, xlim = c(0, 0.8), ylim = c(0, 8))
legend('topright', legend = c('data1', 'data2'), col=c("red", "blue"), lty=1, lwd = 2)
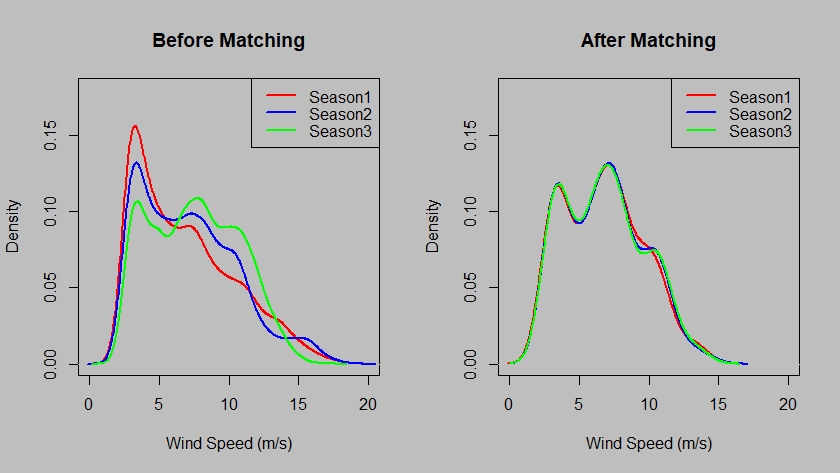
2. Matching many
The function can be used to match, when the number of data sets are more than two.
# Load library
library(WindPlus)

# Prepare data set for matching
dname = rep(list(), 3)
dname[[1]] = Season1
dname[[2]] = Season2
dname[[3]] = Season3

# Non circular covariates column
cov = c(1, 6, 14)

# Weight
weight = c(0.2, 0.2, 0.2)

# Matching
matched = covmatch.mult(dname = dname, weight = weight, cov = cov, cov_circ = NULL)

# Commpare result of one covariate with original data
dev.new(width = 550, height = 330, unit = "px")
par(mfrow =  c(1, 2))
par(bg = 'grey')

plot(density(dname[[1]][, 1]), col = 'red', main = 'Before Matching', xlab = 'Wind Speed (m/s)', lwd = 2, xlim = c(0, 20), ylim = c(0, 0.18))
lines(density(dname[[2]][, 1]), col = 'blue', lwd = 2, xlim = c(0, 20), ylim = c(0, 0.18))
lines(density(dname[[3]][, 1]), col = 'green', lwd = 2, xlim = c(0, 20), ylim = c(0, 0.18))
legend('topright',legend = c('Season1', 'Season2', 'Season3'), col=c("red", "blue", "green"), lty=1, lwd = 2)

plot(density(matched[[1]][, 1]), col = 'red', main = 'After Matching', xlab = 'Wind Speed (m/s)', lwd = 2, xlim = c(0, 20), ylim = c(0, 0.18))
lines(density(matched[[2]][, 1]), col = 'blue', lwd = 2, xlim = c(0, 20), ylim = c(0, 0.18))
lines(density(matched[[3]][, 1]), col = 'green', lwd = 2, xlim = c(0, 20), ylim = c(0, 0.18))
legend('topright',legend = c('Season1', 'Season2', 'Season3'), col=c("red", "blue", "green"), lty=1, lwd = 2)
Note :- Even covmatch.mult() function can be used to match two data sets, but it is suggested to use covmatch.binary() when the number of data sets are two.
Details
For more information on WindPlus Package, please access the package documentations or vignettes. Please feel free to contact the author.
nitesh-1507/WindPlus documentation built on Dec. 8, 2019, 1:57 p.m.
R Package Documentation
Browse R Packages
We want your feedback!
Note that we can't provide technical support on individual packages. You should contact the package authors for that.
WindPlus Package
Introduction
The package aims at unveiling a unique technique called covariate matching, which takes in different data sets and returns data sets whose feature values exhibit similar characteristics or similar distribution.
Theory
Covariate matching methods are rooted in the statistical literature. In stabilizing the non-experimental discrepancy between non-treated and treated subjects of observational data, covariate distributions are adjusted by selecting non-treated subjects that have a similar covariate condition as that of treated ones. Through the process of matching, non-treated and treated groups become only randomly different on all background covariates, as if these covariates were designed by experimenters. As a result, the outcomes of the matched non-treated and treated groups, which keep the originally observed values, are comparable under the matched covariate conditions.
1. Definition
Covariate matching is a technique to adjust covariates distribution to make treated and non treated group to have the same covariates condition.
2. Algorithm
Covariate matching is broadly divided into steps : Hierarchial subgrouping and one to one matching.
Hierarchial subrouping - Filters data record in non-treated group which satifies the threshold condition for each data record in treated group.
- Locate a data record in the treated group, Qaft, and label it by the index j.
- Select one of the covariates, for instance, wind speed, V , and designate it as the variable of which the similarity between two data records is computed.
- Go through the data records in the non-treated group, Qbef, by selecting the subset of data records such that the difference, in terms of the designated covariate, between the data record j in Qaft and any one of the records in Qbef is smaller than a pre-specified threshold. When V is in fact the one designated in Step 2, the resulting subset is then labeled by placing V as the subscript to Q, namely QV .
- Next, designate another covariate and use it to prune QV in the same way as one prunes Qbef into QV in Step 3. Doing so produces a smaller subset nested within QV . Then continue with another covariate until all covariates are used.
One to One matching - returns the most similar data record after hierarchial sub-grouping
- Select the most similar record from Qbef for each Qaft using mahalanobis distance as the similarity measure.
- Remove the record from Qaft, if a record in Qbef satisfies the above mentioned criteria.
- Repeat the process for each record in Qaft
Installation
The package building relies on certain tool chains in windows and mac respectively, as the compiler for C++ code along with package devtools
Step 1 (Download necessary tool chain):
Tool chain : Rtools - Windows, GFortran - Mac OS
Step 2 (Install package devtools in R):
Install package devtools:
install.packages("devtools")
Step 3 (Build package using devtools):
devtools::install_github("nitesh-1507/WindPlus", build_vignettes = TRUE)
devtools::install_github("nitesh-1507/WindPlus", build_vignettes = FALSE) [Note : only use if above command along with vignette building fails]
Usage
The package can be used to match many different data sets. Broadly two functions are available to match the data sets provided by user.
Loading library
library(WindPlus)
1. Matching binary
The function can be used to match, when the number data sets are two.
# Load library
library(WindPlus)
# Prepare data set for matching
dname = rep(list(), 2)
dname[[1]] = data1
dname[[2]] = data2
# Non circular covariates column
cov = c(6, 1, 13)
# Weight
weight = c(0.1, 0.1, 0.05)
# Matching
matched = covmatch.binary(dname = dname, weight = weight, cov = cov, cov_circ = NULL)
# Commpare result of one covariate with original data
dev.new(width = 550, height = 330, unit = "px")
par(mfrow = c(1, 2))
par(bg = 'grey')
plot(density(dname[[1]][, 13]), col = 'red', main = 'Before Matching', xlab = 'Turbulence Intensity', lwd = 2, xlim = c(0, 0.8), ylim = c(0, 8))
lines(density(dname[[2]][, 13]), col = 'blue', lwd = 2, ylim = c(0, 8), xlim = c(0, 0.8), ylim = c(0, 8))
legend('topright', legend = c('data1', 'data2'), col=c("red", "blue"), lty=1, lwd = 2)
plot(density(matched[[1]][, 13]), col = 'red', main = 'After Matching', xlab = 'Turbulence Intensity', lwd = 2, xlim = c(0, 0.8), ylim = c(0, 8))
lines(density(matched[[2]][,13]), col = 'blue', lwd = 2, xlim = c(0, 0.8), ylim = c(0, 8))
legend('topright', legend = c('data1', 'data2'), col=c("red", "blue"), lty=1, lwd = 2)
2. Matching many
The function can be used to match, when the number of data sets are more than two.
# Load library
library(WindPlus)
# Prepare data set for matching
dname = rep(list(), 3)
dname[[1]] = Season1
dname[[2]] = Season2
dname[[3]] = Season3
# Non circular covariates column
cov = c(1, 6, 14)
# Weight
weight = c(0.2, 0.2, 0.2)
# Matching
matched = covmatch.mult(dname = dname, weight = weight, cov = cov, cov_circ = NULL)
# Commpare result of one covariate with original data
dev.new(width = 550, height = 330, unit = "px")
par(mfrow = c(1, 2))
par(bg = 'grey')
plot(density(dname[[1]][, 1]), col = 'red', main = 'Before Matching', xlab = 'Wind Speed (m/s)', lwd = 2, xlim = c(0, 20), ylim = c(0, 0.18))
lines(density(dname[[2]][, 1]), col = 'blue', lwd = 2, xlim = c(0, 20), ylim = c(0, 0.18))
lines(density(dname[[3]][, 1]), col = 'green', lwd = 2, xlim = c(0, 20), ylim = c(0, 0.18))
legend('topright',legend = c('Season1', 'Season2', 'Season3'), col=c("red", "blue", "green"), lty=1, lwd = 2)
plot(density(matched[[1]][, 1]), col = 'red', main = 'After Matching', xlab = 'Wind Speed (m/s)', lwd = 2, xlim = c(0, 20), ylim = c(0, 0.18))
lines(density(matched[[2]][, 1]), col = 'blue', lwd = 2, xlim = c(0, 20), ylim = c(0, 0.18))
lines(density(matched[[3]][, 1]), col = 'green', lwd = 2, xlim = c(0, 20), ylim = c(0, 0.18))
legend('topright',legend = c('Season1', 'Season2', 'Season3'), col=c("red", "blue", "green"), lty=1, lwd = 2)
Note :- Even covmatch.mult() function can be used to match two data sets, but it is suggested to use covmatch.binary() when the number of data sets are two.
Details
For more information on WindPlus Package, please access the package documentations or vignettes. Please feel free to contact the author.
R Package Documentation
Browse R Packages
We want your feedback!
Note that we can't provide technical support on individual packages. You should contact the package authors for that.
Embedding an R snippet on your website
Add the following code to your website.
For more information on customizing the embed code, read Embedding Snippets.