README.md
In oleon12/BatWing: Lifting Surface Area and Dynamic Measures for a Bat wing
BatWing
Package write in the R programming language
Version 1.0.0. Beta (2016-06-10)
Author Leon-Alvarado, Omar Daniel
Contact leon.alvarado12@gmail.com
This package calculates the Lifting Surface Area (LSA) of a Bat's wing using different formulas, and also calculate the dynamics measures of the Bat's wing.
The input files for both LSA function and Dynamics function are very specific, the colums order must be the same as the example data ( https://github.com/oleon12/BatWing/tree/master/data ).
Installation
library("devtools")

install_github("oleon12/BatWing")
Formulas
The LSA formulas which this package use are the proposal by:
- Pirlot 1977
 - Smith & Starrett 1979

where:
- Blood & McFarlane 1988

- Aldrige 1988
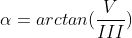
Where:
FA = Forearm Length, B= Wingspan
, III = Digit 3 Length, IV = Digit 4 Length
, V = Digit 5 Length, M = Mass*
The Dynamics formulas which this package use are:
- Aspect Ratio (Vaughan 1959; Norberg & Rayner 1987)

- Wing Loading (Norberg & Rayner 1987)
- Relative Wing Loading (Norberg 2000)
- Minimum Power Speed (Norber & Rayner 1987)

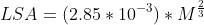
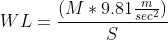
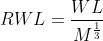
Where:
S = LSA in squared meters, B= Wingspan in squared meters
, 9.81 = Gravity constant, M = Mass in Kilograms*
Example
BatWingArea()
BatWingArea function calculate the Lifting Surface Area of a bat wing using different wing measures (see Formulas section).
This function also calculate the mean, standard deviation and variance of the input variables and LSA measures.
Load the library and the example data "wing", then check what is in the data.
The data contains the identification colum (id)(in this case colector acronym, but also could be species name or other name),
Forearm length, length of the digits 5, 4 and 3, mass and wingspan. All measures are in milimeters and grames. The id colum always must be a colum, never row names. The variables sort of the input data must be the same as this example data, if not, the calculation will be wrong.
library(BatWing)

data(wing)
head(wing)
         id ForearmLength Digit5.Length Digit4.Length Digit3.Length Mass Wingspan
1 ODLAM-011          41.4         63.20         61.70         87.50 15.5      330
2 ODLAM-010          42.4         64.10         62.60         94.90 17.5      325
3 ODLAM-012          37.9         54.60         58.20         76.00  9.0      295
4 ODLAM-014          41.5         58.30         58.95         79.70 16.5      319
5 ODLAM-016          31.0         28.40         49.90         60.75  7.5      238
6 ODLAM-018          42.1         59.15         61.90         79.90 15.5      331
Now, calculate the LSA for the wing data. Scale argument transform the variables from milimeters and grames to meters and kilograms, so you can have the LSA in squared meters or squared milimeters
The outcome LSA is a S3 object with two data frames : 1. Area (the LSA measures) and 2. Stats (variables statistics).
Let's take a look to the LSA measures.
The function calculated four different LSA formulas: BM: Blood & McFarlane 1988, A: Aldrige 1988, SS: Smith & Starrett 1979 and P: Pirlot 1977 (detailed formulas in Formulas section).
LSA <- BatWingArea(x=wing, scale=F)
head(LSA$Area)
                 BM         A        SS         P
ODLAM-011 10762.960 0.2282375 11892.700 15329.160
ODLAM-010 11518.770 0.2909375 12604.629 15311.887
ODLAM-012  8288.280 0.0769500  9585.018 11838.645
ODLAM-014  9485.410 0.2586375 10660.039 13669.309
ODLAM-016  3486.100 0.0534375  5107.123  4968.012
ODLAM-018  9706.515 0.2282375 11134.029 14390.308
Now, let's take a look to the variables statistics.
LSA$Stats
     ForearmLength Digit5.Length Digit4.Length Digit3.Length      Mass   Wingspan           BM         A           SS            P
mean      43.60000      55.67000      62.89500      84.46500 17.750000  337.30000    10021.071 0.3657263    11733.002    14470.143
sd        10.87288      16.09049      13.36127      17.12325  8.813657   77.11326     4945.237 0.4191581     5577.896     7309.019
var      118.21944     258.90400     178.52358     293.20558 77.680556 5946.45556 24455364.257 0.1756935 31112928.033 53421752.534
If you want an specific LSA method for you data, you can use the method argument to specify what method you desire.
In this case I want only the Blood & McFarlane (BM) and Starret & Smith (SS) methods.
LSA <- BatWingArea(x=wing, scale=F, method=c("BM","SS"))
head(LSA$Area)
                 BM        SS
ODLAM-011 10762.960 11892.700
ODLAM-010 11518.770 12604.629
ODLAM-012  8288.280  9585.018
ODLAM-014  9485.410 10660.039
ODLAM-016  3486.100  5107.123
ODLAM-018  9706.515 11134.029
BatWingDynamics()
From the Bat wing, we can take different dynamics measures who are util for different studies associated with diet, behaivor, etc. BatWingDynamics() calculates the Aspect Ratio (AR), Wing Loading (WL), Relative Wing Loading (RWL) and Minimum Power Speed (MPS) for a Bat wing, to see the detailed formula see Formulas section. This function also calculates mean, standard deviation and variance of the input variables and the dynamics measures.
Load the library and the example data "dynamics", then check what is in the data.
The data contains the identification colum (id)(in this case colector acronym, but also could be species name or other name),
Mass, Wingspan and LSA (in squared meters in this case). All measures are in milimeters and grames (with the exception of the LSA). The id colum always must be a colum, never row names. The variables sort of the input data must be the same as this example data, if not, the calculation will be wrong.
library(BatWing)

data(dynamics)
head(dynamics)
         ID Mass Wingspan Area(inM^2)
1 ODLAM-011 15.5      330 0.011892700
2 ODLAM-010 17.5      325 0.012604629
3 ODLAM-012  9.0      295 0.009585018
4 ODLAM-014 16.5      319 0.010660039
5 ODLAM-016  7.5      238 0.005107123
6 ODLAM-018 15.5      331 0.011134029
Now, calculate the dynamics measures for the wing data. Scale argument transform the variables from milimeters and grames to meters and kilograms, so you can have the LSA in squared meters or squared milimeters, due to the Mass and Wingspan are in milimeters and grames and the LSA in squared meters its necessary transform these variables.
The outcome Dym is a S3 object with two data frames : 1. Dynamics (the dynamics measures) and 2. Stats (variables statistics).
Let's take a look to the LSA measures.
The function calculated four different dynamics measures: AR: Aspect Ratio (Vaughan 1959; Norberg & Rayner 1987), WL: Wing Loading (Norberg & Rayner 1987), RWL: Relative Wing Loading (Norberg 2000) and MPS: Minimum Power Speed (Norberg & Rayner 1987) (detailed formulas in Formulas section).
Dym <- BatWingDynamics(x=dynamics, scale=T)
head(Dym$Dynamics)
                 AR       WL      RWL      MPS
ODLAM-011  9.156878 12.78557 51.27941 3.715662
ODLAM-010  8.379858 13.62000 52.46032 3.905866
ODLAM-012  9.079273  9.21125 44.28307 3.218072
ODLAM-014  9.546025 15.18428 59.64392 3.940761
ODLAM-016 11.091175 14.40635 73.59814 3.625027
ODLAM-018  9.840194 13.65678 54.77358 3.746655
Now, let's take a look to the variables statistics.
Dym$Stats
             Mass    Wingspan  Area(inM^2)        AR       WL       RWL       MPS
mean 1.775000e-02 0.337300000 1.173300e-02 10.333714 15.48375  61.14137 3.8564452
sd   8.813657e-03 0.077113264 5.577896e-03  1.752498  5.16755  20.17576 0.3835981
var  7.768056e-05 0.005946456 3.111293e-05  3.071250 26.70357 407.06138 0.1471475
If you want an specific dynamic measures for you data, you can use the method argument to specify what measure you desire.
In this case I want only the Aspect Ratio (AR) and Relative Wing Loading (SS) measures.
Dym <- BatWingDynamics(x= dynamics, scale=T, method = c("AR","RWL"))
head(Dym$Dynamics)
                 AR      RWL
ODLAM-011  9.156878 51.27941
ODLAM-010  8.379858 52.46032
ODLAM-012  9.079273 44.28307
ODLAM-014  9.546025 59.64392
ODLAM-016 11.091175 73.59814
ODLAM-018  9.840194 54.77358
BatWingAll()
BatWingAll() function is a combination of BatWingArea() and BatWingDynamics() functions. Using the data "wing" BatWingAll() first calculates the LSA and the using the four LSA results calculates the Dynamics measures. So at the end the you will have four Dynamics measures, each one calcuated using each LSA method.
The outcome is a more complex S3 object with two objectos inside: 1. Dynamics, a list object with the dynamics measures, the list contain four data frames, each one is the dynamics measures calulates with an single LSA method. 2. Stats, a list objects with the variables statistics, the list contain four data frames, each one correspond to each LSA method.
data(wing)

All <- BatWingAll(x=wing, scale=T)

All$Dynamics
$BloodMcFarlane
                 Area        AR       WL       RWL      MPS
ODLAM-011 0.010762960 10.118034 14.12762  56.66198 3.770959
ODLAM-010 0.011518770  9.169816 14.90394  57.40569 3.958291
ODLAM-012 0.008288280 10.499766 10.65239  51.21135 3.288053
ODLAM-014 0.009485410 10.728160 17.06463  67.02994 4.009443
ODLAM-016 0.003486100 16.248530 21.10525 107.82100 3.835792
ODLAM-018 0.009706515 11.287367 15.66525  62.82900 3.823516
ODLAM-019 0.007846080 11.778621 23.75581  89.02637 4.478730
ODLAM-020 0.021146895 12.347959 18.55592  54.25783 4.128812
ODLAM-021 0.013487540 13.518329 14.91043  54.48022 3.627280
ODLAm-022 0.004482160 19.153488 36.11317 141.85270 4.666104

$Aldrige
                  Area        AR        WL       RWL      MPS
ODLAM-011 2.282375e-07  477134.6  666213.9 2672000.1 18.54114
ODLAM-010 2.909375e-07  363050.5  590075.2 2272800.6 18.96503
ODLAM-012 7.695000e-08 1130929.2 1147368.4 5515972.0 18.26891
ODLAM-014 2.586375e-07  393450.3  625837.3 2458292.0 18.99372
ODLAM-016 5.343750e-08 1060004.7 1376842.1 7033913.9 19.78792
ODLAM-018 2.282375e-07  480030.7  666213.9 2672000.1 18.51429
ODLAM-019 3.429500e-07  269473.7  543490.3 2036763.5 19.78560
ODLAM-020 1.520000e-06  171790.1  258157.9  754858.3 16.94528
ODLAM-021 3.992375e-07  456693.1  503722.7 1840518.8 16.97574
ODLAm-022 2.586375e-07  331927.9  625837.3 2458292.0 19.78318

$SmithStarrett
                 Area        AR       WL       RWL      MPS
ODLAM-011 0.011892700  9.156878 12.78557  51.27941 3.715662
ODLAM-010 0.012604629  8.379858 13.62000  52.46032 3.905866
ODLAM-012 0.009585018  9.079273  9.21125  44.28307 3.218072
ODLAM-014 0.010660039  9.546025 15.18428  59.64392 3.940761
ODLAM-016 0.005107123 11.091175 14.40635  73.59814 3.625027
ODLAM-018 0.011134029  9.840194 13.65678  54.77358 3.746655
ODLAM-019 0.009181822 10.065105 20.29989  76.07510 4.375725
ODLAM-020 0.024440866 10.683787 16.05508  46.94533 4.041293
ODLAM-021 0.016881464 10.800544 11.91277  43.52727 3.508766
ODLAm-022 0.005842332 14.694303 27.70555 108.82752 4.486625

$Pirlot
                 Area        AR        WL      RWL      MPS
ODLAM-011 0.015329160  7.104107  9.919330 39.78369 3.578664
ODLAM-010 0.015311887  6.898235 11.211877 43.18494 3.794998
ODLAM-012 0.011838645  7.350926  7.457779 35.85326 3.119053
ODLAM-014 0.013669310  7.444487 11.841491 46.51343 3.798375
ODLAM-016 0.004968012 11.401744 14.809747 75.65899 3.639874
ODLAM-018 0.014390308  7.613527 10.566487 42.37926 3.607064
ODLAM-019 0.011797632  7.833436 15.798933 59.20748 4.216361
ODLAM-020 0.031605478  8.261891 12.415569 36.30334 3.890423
ODLAM-021 0.019050391  9.570879 10.556476 38.57160 3.446556
ODLAm-022 0.006740612 12.736085 24.013400 94.32475 4.392654
In general, the dynamics measures are calculated using the LSA in meters, so always when scale argument is FALSE a warning message appears. Don't worry, is just an advice.
All <- BatWingAll(x=wing, scale=F)
Warning message:
In BatWingAll(bat.m, scale = F) :
  scaleArea is FALSE, remember, for the Dynamic formulas the LSA or Area must be in squared meters
Not all LSA formulas use the whole variables (e.g. Aldrige only use Mass variable, or Blood & McFarlane only use the length of Forearm, and digits V and III), so if you want only the results from a specific method and your data only have the requiere variables for the method you can fill the missing variables with 0 (zeros) in order to use the BatWingArea() function.
For example, you have only the variables requiere to calculate the LSA usign the Blood & McFarlane method (FA, Digit V and III), you fill your missing variables with 0 like this:
          id ForearmLength Digit5.Length Digit4.Length Digit3.Length Mass  Wingspan
1  ODLAM-011         41.40         63.20             0         87.50    0         0
2  ODLAM-010         42.40         64.10             0         94.90    0         0
3  ODLAM-012         37.90         54.60             0         76.00    0         0
4  ODLAM-014         41.50         58.30             0         79.70    0         0
5  ODLAM-016         31.00         28.40             0         60.75    0         0
6  ODLAM-018         42.10         59.15             0         79.90    0         0
7  ODLAM-019         37.10         52.80             0         74.40    0         0
8  ODLAM-020         67.65         84.15             0        116.00    0         0
9  ODLAM-021         57.70         60.70             0        106.80    0         0
10 ODLAm-022         37.25         31.30             0         68.70    0         0
Now, you can use the function.
LSA <- BatWingArea(x=your.data, method=c("BM","A"))

LSA
$Area
                 BM A
ODLAM-011 10762.960 0
ODLAM-010 11518.770 0
ODLAM-012  8288.280 0
ODLAM-014  9485.410 0
ODLAM-016  3486.100 0
ODLAM-018  9706.515 0
ODLAM-019  7846.080 0
ODLAM-020 21146.895 0
ODLAM-021 13487.540 0
ODLAm-022  4482.160 0

$Stats
     ForearmLength Digit5.Length Digit4.Length Digit3.Length Mass Wingspan            BM A
mean      43.60000      55.67000             0      84.46500    0        0     10021.071 0
sd        10.87288      16.09049             0      17.12325    0        0      4945.237 0
var      118.21944     258.90400             0     293.20558    0        0  24455364.257 0
References
-
Aldridge, H. D. J. N. (1988). Flight kinematics and energetics in the little brown bat, Myotis 1ucifugu.v (Chiroptera:
Vespertilionidae), with reference to the influence of ground effect. J . Zoo/., Land. 216: 507-517.
-
Blood, B. R. & McFarlane, D. A. (1988). A new method for calculating the wing area of bats. Mammalia 52: 600-603.
-
Norberg, U. M. & Rayner, J . M. V. (1987). Ecological morphology and flight in bats (Mammalia; Chiroptcra): wing
adaptations. flight performance, foraging strategy and echolocation. Phil. Trails. R. Soc. ( B ) 316: 335-427.
-
Pirlot, P. (1977). Wing design and the origin of bats. In Major patterns in vertebrate evolution: 375 410. Hecht, M. K.,
Goody, P. C. & Hecht, B. M. (Eds). New York: Plenum Press.
-
Smith, J. D. & Starrett, A. (1979). Morphometric analysis of chiropteran wings. Spec. Publs Mus. Texas tech. Unir. No. 16:
229 316.
-
Vaughan, T. A. (1959). Functional morphology of three bats: Eumops, Myotis, Macrotus. Univ. Kans. Publs Mus. nut. Hist.
12: 1-153.
oleon12/BatWing documentation built on July 28, 2020, 12:10 p.m.
R Package Documentation
Browse R Packages
We want your feedback!
Note that we can't provide technical support on individual packages. You should contact the package authors for that.
BatWing
Package write in the R programming language
Version 1.0.0. Beta (2016-06-10)
Author Leon-Alvarado, Omar Daniel
Contact leon.alvarado12@gmail.com
This package calculates the Lifting Surface Area (LSA) of a Bat's wing using different formulas, and also calculate the dynamics measures of the Bat's wing.
The input files for both LSA function and Dynamics function are very specific, the colums order must be the same as the example data ( https://github.com/oleon12/BatWing/tree/master/data ).
Installation
library("devtools")
install_github("oleon12/BatWing")
Formulas
The LSA formulas which this package use are the proposal by:
- Pirlot 1977
- Smith & Starrett 1979
where:
- Blood & McFarlane 1988
- Aldrige 1988
Where:
FA = Forearm Length, B= Wingspan , III = Digit 3 Length, IV = Digit 4 Length , V = Digit 5 Length, M = Mass*
The Dynamics formulas which this package use are:
- Aspect Ratio (Vaughan 1959; Norberg & Rayner 1987)
- Wing Loading (Norberg & Rayner 1987)
- Relative Wing Loading (Norberg 2000)
- Minimum Power Speed (Norber & Rayner 1987)
Where:
S = LSA in squared meters, B= Wingspan in squared meters , 9.81 = Gravity constant, M = Mass in Kilograms*
Example
BatWingArea()
BatWingArea function calculate the Lifting Surface Area of a bat wing using different wing measures (see Formulas section). This function also calculate the mean, standard deviation and variance of the input variables and LSA measures.
Load the library and the example data "wing", then check what is in the data.
The data contains the identification colum (id)(in this case colector acronym, but also could be species name or other name), Forearm length, length of the digits 5, 4 and 3, mass and wingspan. All measures are in milimeters and grames. The id colum always must be a colum, never row names. The variables sort of the input data must be the same as this example data, if not, the calculation will be wrong.
library(BatWing)
data(wing)
head(wing)
id ForearmLength Digit5.Length Digit4.Length Digit3.Length Mass Wingspan
1 ODLAM-011 41.4 63.20 61.70 87.50 15.5 330
2 ODLAM-010 42.4 64.10 62.60 94.90 17.5 325
3 ODLAM-012 37.9 54.60 58.20 76.00 9.0 295
4 ODLAM-014 41.5 58.30 58.95 79.70 16.5 319
5 ODLAM-016 31.0 28.40 49.90 60.75 7.5 238
6 ODLAM-018 42.1 59.15 61.90 79.90 15.5 331
Now, calculate the LSA for the wing data. Scale argument transform the variables from milimeters and grames to meters and kilograms, so you can have the LSA in squared meters or squared milimeters
The outcome LSA is a S3 object with two data frames : 1. Area (the LSA measures) and 2. Stats (variables statistics). Let's take a look to the LSA measures.
The function calculated four different LSA formulas: BM: Blood & McFarlane 1988, A: Aldrige 1988, SS: Smith & Starrett 1979 and P: Pirlot 1977 (detailed formulas in Formulas section).
LSA <- BatWingArea(x=wing, scale=F)
head(LSA$Area)
BM A SS P
ODLAM-011 10762.960 0.2282375 11892.700 15329.160
ODLAM-010 11518.770 0.2909375 12604.629 15311.887
ODLAM-012 8288.280 0.0769500 9585.018 11838.645
ODLAM-014 9485.410 0.2586375 10660.039 13669.309
ODLAM-016 3486.100 0.0534375 5107.123 4968.012
ODLAM-018 9706.515 0.2282375 11134.029 14390.308
Now, let's take a look to the variables statistics.
LSA$Stats
ForearmLength Digit5.Length Digit4.Length Digit3.Length Mass Wingspan BM A SS P
mean 43.60000 55.67000 62.89500 84.46500 17.750000 337.30000 10021.071 0.3657263 11733.002 14470.143
sd 10.87288 16.09049 13.36127 17.12325 8.813657 77.11326 4945.237 0.4191581 5577.896 7309.019
var 118.21944 258.90400 178.52358 293.20558 77.680556 5946.45556 24455364.257 0.1756935 31112928.033 53421752.534
If you want an specific LSA method for you data, you can use the method argument to specify what method you desire. In this case I want only the Blood & McFarlane (BM) and Starret & Smith (SS) methods.
LSA <- BatWingArea(x=wing, scale=F, method=c("BM","SS"))
head(LSA$Area)
BM SS
ODLAM-011 10762.960 11892.700
ODLAM-010 11518.770 12604.629
ODLAM-012 8288.280 9585.018
ODLAM-014 9485.410 10660.039
ODLAM-016 3486.100 5107.123
ODLAM-018 9706.515 11134.029
BatWingDynamics()
From the Bat wing, we can take different dynamics measures who are util for different studies associated with diet, behaivor, etc. BatWingDynamics() calculates the Aspect Ratio (AR), Wing Loading (WL), Relative Wing Loading (RWL) and Minimum Power Speed (MPS) for a Bat wing, to see the detailed formula see Formulas section. This function also calculates mean, standard deviation and variance of the input variables and the dynamics measures.
Load the library and the example data "dynamics", then check what is in the data.
The data contains the identification colum (id)(in this case colector acronym, but also could be species name or other name), Mass, Wingspan and LSA (in squared meters in this case). All measures are in milimeters and grames (with the exception of the LSA). The id colum always must be a colum, never row names. The variables sort of the input data must be the same as this example data, if not, the calculation will be wrong.
library(BatWing)
data(dynamics)
head(dynamics)
ID Mass Wingspan Area(inM^2)
1 ODLAM-011 15.5 330 0.011892700
2 ODLAM-010 17.5 325 0.012604629
3 ODLAM-012 9.0 295 0.009585018
4 ODLAM-014 16.5 319 0.010660039
5 ODLAM-016 7.5 238 0.005107123
6 ODLAM-018 15.5 331 0.011134029
Now, calculate the dynamics measures for the wing data. Scale argument transform the variables from milimeters and grames to meters and kilograms, so you can have the LSA in squared meters or squared milimeters, due to the Mass and Wingspan are in milimeters and grames and the LSA in squared meters its necessary transform these variables.
The outcome Dym is a S3 object with two data frames : 1. Dynamics (the dynamics measures) and 2. Stats (variables statistics). Let's take a look to the LSA measures.
The function calculated four different dynamics measures: AR: Aspect Ratio (Vaughan 1959; Norberg & Rayner 1987), WL: Wing Loading (Norberg & Rayner 1987), RWL: Relative Wing Loading (Norberg 2000) and MPS: Minimum Power Speed (Norberg & Rayner 1987) (detailed formulas in Formulas section).
Dym <- BatWingDynamics(x=dynamics, scale=T)
head(Dym$Dynamics)
AR WL RWL MPS
ODLAM-011 9.156878 12.78557 51.27941 3.715662
ODLAM-010 8.379858 13.62000 52.46032 3.905866
ODLAM-012 9.079273 9.21125 44.28307 3.218072
ODLAM-014 9.546025 15.18428 59.64392 3.940761
ODLAM-016 11.091175 14.40635 73.59814 3.625027
ODLAM-018 9.840194 13.65678 54.77358 3.746655
Now, let's take a look to the variables statistics.
Dym$Stats
Mass Wingspan Area(inM^2) AR WL RWL MPS
mean 1.775000e-02 0.337300000 1.173300e-02 10.333714 15.48375 61.14137 3.8564452
sd 8.813657e-03 0.077113264 5.577896e-03 1.752498 5.16755 20.17576 0.3835981
var 7.768056e-05 0.005946456 3.111293e-05 3.071250 26.70357 407.06138 0.1471475
If you want an specific dynamic measures for you data, you can use the method argument to specify what measure you desire. In this case I want only the Aspect Ratio (AR) and Relative Wing Loading (SS) measures.
Dym <- BatWingDynamics(x= dynamics, scale=T, method = c("AR","RWL"))
head(Dym$Dynamics)
AR RWL
ODLAM-011 9.156878 51.27941
ODLAM-010 8.379858 52.46032
ODLAM-012 9.079273 44.28307
ODLAM-014 9.546025 59.64392
ODLAM-016 11.091175 73.59814
ODLAM-018 9.840194 54.77358
BatWingAll()
BatWingAll() function is a combination of BatWingArea() and BatWingDynamics() functions. Using the data "wing" BatWingAll() first calculates the LSA and the using the four LSA results calculates the Dynamics measures. So at the end the you will have four Dynamics measures, each one calcuated using each LSA method.
The outcome is a more complex S3 object with two objectos inside: 1. Dynamics, a list object with the dynamics measures, the list contain four data frames, each one is the dynamics measures calulates with an single LSA method. 2. Stats, a list objects with the variables statistics, the list contain four data frames, each one correspond to each LSA method.
data(wing)
All <- BatWingAll(x=wing, scale=T)
All$Dynamics
$BloodMcFarlane
Area AR WL RWL MPS
ODLAM-011 0.010762960 10.118034 14.12762 56.66198 3.770959
ODLAM-010 0.011518770 9.169816 14.90394 57.40569 3.958291
ODLAM-012 0.008288280 10.499766 10.65239 51.21135 3.288053
ODLAM-014 0.009485410 10.728160 17.06463 67.02994 4.009443
ODLAM-016 0.003486100 16.248530 21.10525 107.82100 3.835792
ODLAM-018 0.009706515 11.287367 15.66525 62.82900 3.823516
ODLAM-019 0.007846080 11.778621 23.75581 89.02637 4.478730
ODLAM-020 0.021146895 12.347959 18.55592 54.25783 4.128812
ODLAM-021 0.013487540 13.518329 14.91043 54.48022 3.627280
ODLAm-022 0.004482160 19.153488 36.11317 141.85270 4.666104
$Aldrige
Area AR WL RWL MPS
ODLAM-011 2.282375e-07 477134.6 666213.9 2672000.1 18.54114
ODLAM-010 2.909375e-07 363050.5 590075.2 2272800.6 18.96503
ODLAM-012 7.695000e-08 1130929.2 1147368.4 5515972.0 18.26891
ODLAM-014 2.586375e-07 393450.3 625837.3 2458292.0 18.99372
ODLAM-016 5.343750e-08 1060004.7 1376842.1 7033913.9 19.78792
ODLAM-018 2.282375e-07 480030.7 666213.9 2672000.1 18.51429
ODLAM-019 3.429500e-07 269473.7 543490.3 2036763.5 19.78560
ODLAM-020 1.520000e-06 171790.1 258157.9 754858.3 16.94528
ODLAM-021 3.992375e-07 456693.1 503722.7 1840518.8 16.97574
ODLAm-022 2.586375e-07 331927.9 625837.3 2458292.0 19.78318
$SmithStarrett
Area AR WL RWL MPS
ODLAM-011 0.011892700 9.156878 12.78557 51.27941 3.715662
ODLAM-010 0.012604629 8.379858 13.62000 52.46032 3.905866
ODLAM-012 0.009585018 9.079273 9.21125 44.28307 3.218072
ODLAM-014 0.010660039 9.546025 15.18428 59.64392 3.940761
ODLAM-016 0.005107123 11.091175 14.40635 73.59814 3.625027
ODLAM-018 0.011134029 9.840194 13.65678 54.77358 3.746655
ODLAM-019 0.009181822 10.065105 20.29989 76.07510 4.375725
ODLAM-020 0.024440866 10.683787 16.05508 46.94533 4.041293
ODLAM-021 0.016881464 10.800544 11.91277 43.52727 3.508766
ODLAm-022 0.005842332 14.694303 27.70555 108.82752 4.486625
$Pirlot
Area AR WL RWL MPS
ODLAM-011 0.015329160 7.104107 9.919330 39.78369 3.578664
ODLAM-010 0.015311887 6.898235 11.211877 43.18494 3.794998
ODLAM-012 0.011838645 7.350926 7.457779 35.85326 3.119053
ODLAM-014 0.013669310 7.444487 11.841491 46.51343 3.798375
ODLAM-016 0.004968012 11.401744 14.809747 75.65899 3.639874
ODLAM-018 0.014390308 7.613527 10.566487 42.37926 3.607064
ODLAM-019 0.011797632 7.833436 15.798933 59.20748 4.216361
ODLAM-020 0.031605478 8.261891 12.415569 36.30334 3.890423
ODLAM-021 0.019050391 9.570879 10.556476 38.57160 3.446556
ODLAm-022 0.006740612 12.736085 24.013400 94.32475 4.392654
In general, the dynamics measures are calculated using the LSA in meters, so always when scale argument is FALSE a warning message appears. Don't worry, is just an advice.
All <- BatWingAll(x=wing, scale=F)
Warning message:
In BatWingAll(bat.m, scale = F) :
scaleArea is FALSE, remember, for the Dynamic formulas the LSA or Area must be in squared meters
Not all LSA formulas use the whole variables (e.g. Aldrige only use Mass variable, or Blood & McFarlane only use the length of Forearm, and digits V and III), so if you want only the results from a specific method and your data only have the requiere variables for the method you can fill the missing variables with 0 (zeros) in order to use the BatWingArea() function.
For example, you have only the variables requiere to calculate the LSA usign the Blood & McFarlane method (FA, Digit V and III), you fill your missing variables with 0 like this:
id ForearmLength Digit5.Length Digit4.Length Digit3.Length Mass Wingspan
1 ODLAM-011 41.40 63.20 0 87.50 0 0
2 ODLAM-010 42.40 64.10 0 94.90 0 0
3 ODLAM-012 37.90 54.60 0 76.00 0 0
4 ODLAM-014 41.50 58.30 0 79.70 0 0
5 ODLAM-016 31.00 28.40 0 60.75 0 0
6 ODLAM-018 42.10 59.15 0 79.90 0 0
7 ODLAM-019 37.10 52.80 0 74.40 0 0
8 ODLAM-020 67.65 84.15 0 116.00 0 0
9 ODLAM-021 57.70 60.70 0 106.80 0 0
10 ODLAm-022 37.25 31.30 0 68.70 0 0
Now, you can use the function.
LSA <- BatWingArea(x=your.data, method=c("BM","A"))
LSA
$Area
BM A
ODLAM-011 10762.960 0
ODLAM-010 11518.770 0
ODLAM-012 8288.280 0
ODLAM-014 9485.410 0
ODLAM-016 3486.100 0
ODLAM-018 9706.515 0
ODLAM-019 7846.080 0
ODLAM-020 21146.895 0
ODLAM-021 13487.540 0
ODLAm-022 4482.160 0
$Stats
ForearmLength Digit5.Length Digit4.Length Digit3.Length Mass Wingspan BM A
mean 43.60000 55.67000 0 84.46500 0 0 10021.071 0
sd 10.87288 16.09049 0 17.12325 0 0 4945.237 0
var 118.21944 258.90400 0 293.20558 0 0 24455364.257 0
References
-
Aldridge, H. D. J. N. (1988). Flight kinematics and energetics in the little brown bat, Myotis 1ucifugu.v (Chiroptera: Vespertilionidae), with reference to the influence of ground effect. J . Zoo/., Land. 216: 507-517.
-
Blood, B. R. & McFarlane, D. A. (1988). A new method for calculating the wing area of bats. Mammalia 52: 600-603.
-
Norberg, U. M. & Rayner, J . M. V. (1987). Ecological morphology and flight in bats (Mammalia; Chiroptcra): wing adaptations. flight performance, foraging strategy and echolocation. Phil. Trails. R. Soc. ( B ) 316: 335-427.
-
Pirlot, P. (1977). Wing design and the origin of bats. In Major patterns in vertebrate evolution: 375 410. Hecht, M. K., Goody, P. C. & Hecht, B. M. (Eds). New York: Plenum Press.
-
Smith, J. D. & Starrett, A. (1979). Morphometric analysis of chiropteran wings. Spec. Publs Mus. Texas tech. Unir. No. 16: 229 316.
-
Vaughan, T. A. (1959). Functional morphology of three bats: Eumops, Myotis, Macrotus. Univ. Kans. Publs Mus. nut. Hist. 12: 1-153.
R Package Documentation
Browse R Packages
We want your feedback!
Note that we can't provide technical support on individual packages. You should contact the package authors for that.
Embedding an R snippet on your website
Add the following code to your website.
For more information on customizing the embed code, read Embedding Snippets.