inst/app_wikipapa/include.md
In omarbenites/rwikipapa: 'WikiPapa' 'API'
User Manual
body{
font-size: 12pt;
}
The aims to help users how to use the Wikipapa Dashboard. Currently, it consumes data from two sources: the catalog data and the observation data.
Catalag Data Dashboard
The catalog data provide data from 665 potato varieties that have been curated with information regards to morphological characteristics, agronomic performance, nutrient concentration and post-hvarvest performance.
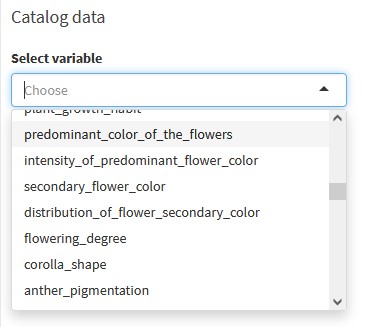
Step 01 : Select Variable
Step 02: chart by type of variable
After selecting one variable, the WikiPapa Dashboard display charts according to the type of variable (categorical or numerical)
- Numerical Variables
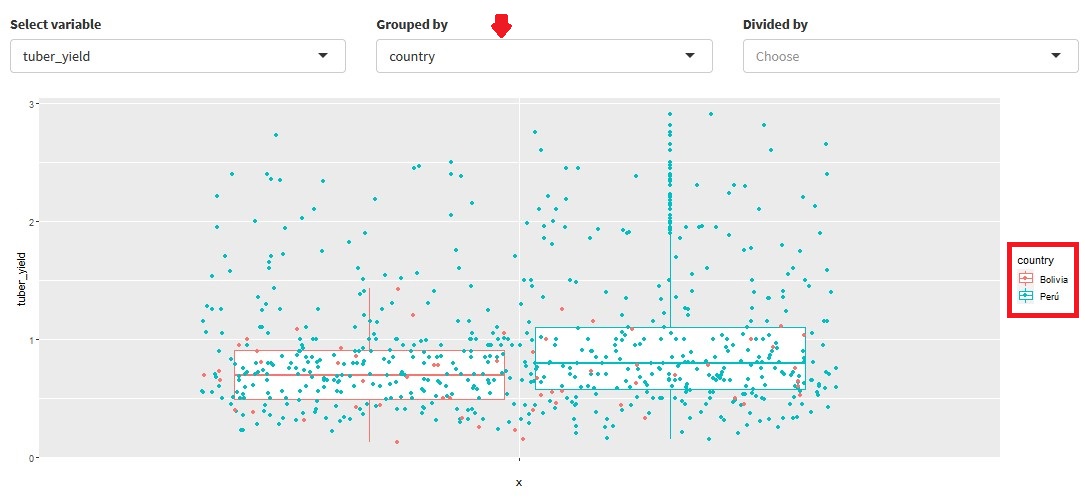
For numerical variables, such as tuber yield, it displays a box plot:
- Categorical Variables
For categorical variables, such as predominant tuber skin color, it display a bar chart
Step 03: Group by box
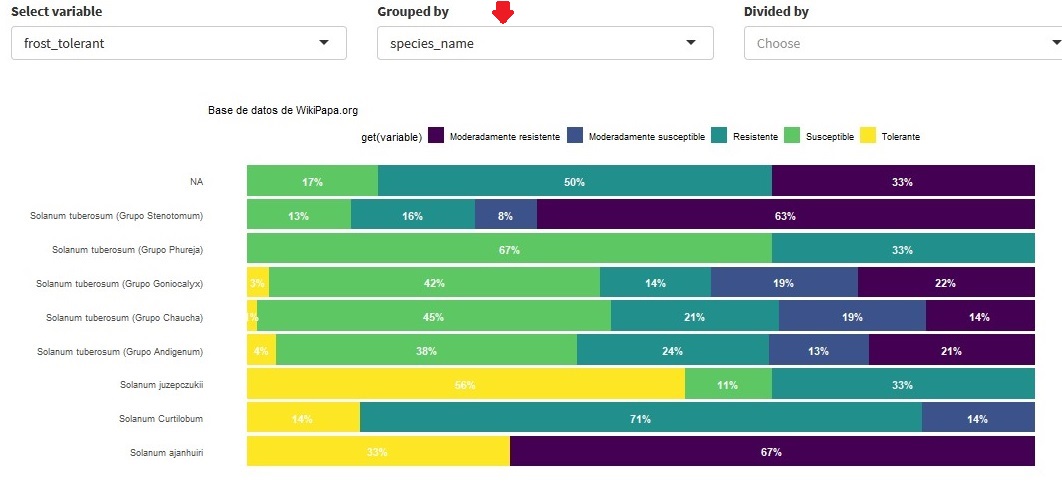
In case you want to aggreagate data by groups, such as species or country, you just select an option in Grouped by combo.
Group by for numerical variables
For numerical variables, it displays grouped box plots.
Group by for categorical variables
For categorical variables grouped by other categorical variables, it displays a stacker bar chart.
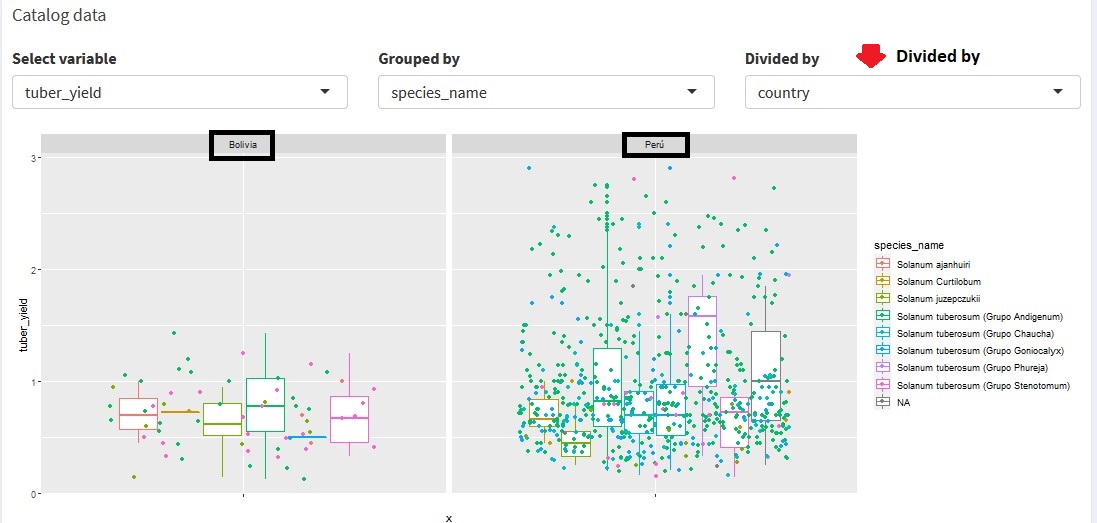
Step 04: Divided by (only for numerical variables)
If users select divided by they split their standard or grouped charts by another criteria. It is only available for numerical variables.
For example, for tuber yield, you can divide your graphic by country.
omarbenites/rwikipapa documentation built on May 14, 2022, 10:52 a.m.
R Package Documentation
Browse R Packages
We want your feedback!
Note that we can't provide technical support on individual packages. You should contact the package authors for that.
User Manual
body{ font-size: 12pt; }The aims to help users how to use the Wikipapa Dashboard. Currently, it consumes data from two sources: the catalog data and the observation data.
Catalag Data Dashboard
The catalog data provide data from 665 potato varieties that have been curated with information regards to morphological characteristics, agronomic performance, nutrient concentration and post-hvarvest performance.
Step 01 : Select Variable
Step 02: chart by type of variable
After selecting one variable, the WikiPapa Dashboard display charts according to the type of variable (categorical or numerical)
- Numerical Variables
For numerical variables, such as tuber yield, it displays a box plot:
- Categorical Variables
For categorical variables, such as predominant tuber skin color, it display a bar chart
Step 03: Group by box
In case you want to aggreagate data by groups, such as species or country, you just select an option in Grouped by combo.
Group byfor numerical variables
For numerical variables, it displays grouped box plots.
Group byfor categorical variables
For categorical variables grouped by other categorical variables, it displays a stacker bar chart.
Step 04: Divided by (only for numerical variables)
If users select divided by they split their standard or grouped charts by another criteria. It is only available for numerical variables.
For example, for tuber yield, you can divide your graphic by country.
R Package Documentation
Browse R Packages
We want your feedback!
Note that we can't provide technical support on individual packages. You should contact the package authors for that.
Embedding an R snippet on your website
Add the following code to your website.
For more information on customizing the embed code, read Embedding Snippets.