In petermeissner/statsgrokse: R 'API' Binding to Stats.grok.se Server
knitr::opts_chunk$set(
  collapse = TRUE,
  comment = "##",
  fig.path = "README-"
)
options("width"=110)
tmp <- packageDescription( basename(getwd()) )
cat("#", tmp$Title)
filelist.R   <- list.files("R", recursive = TRUE, pattern="\\.R$", ignore.case = TRUE, full.names = TRUE)
filelist.tests   <- list.files("tests", recursive = TRUE, pattern="\\.R$", ignore.case = TRUE, full.names = TRUE)
filelist.cpp <- list.files("src", recursive = TRUE, pattern="\\.cpp$", ignore.case = TRUE, full.names = TRUE)
lines.R      <- unlist(lapply(filelist.R, readLines))
lines.tests  <- unlist(lapply(filelist.tests, readLines))
lines.cpp    <- unlist(lapply(filelist.cpp, readLines))
length.R     <- length(grep("(^\\s*$)|(^\\s*#)|(^\\s*//)", lines.R,  value = TRUE, invert = TRUE))
length.tests <- length(grep("(^\\s*$)|(^\\s*#)|(^\\s*//)", lines.tests,  value = TRUE, invert = TRUE))
length.cpp   <- length(grep("(^\\s*$)|(^\\s*#)|(^\\s*//)", lines.cpp,  value = TRUE, invert = TRUE))
Status
lines of R code: r length.R, lines of test code: r length.tests
Development version
source_files <-
  grep(
    "/R/|/src/|/tests/",
    list.files(recursive = TRUE, full.names = TRUE),
    value = TRUE
  )
last_change <-
  as.character(
    format(max(file.info(source_files)$mtime), tz="UTC")
  )
cat(tmp$Version)
cat(" - ")
cat(stringr::str_replace(last_change, " ", " / "))
Description
cat(tmp$Description)
License
cat(tmp$License, "<br>")
cat(tmp$Author)
Citation
citation("statsgrokse")
BibTex for citing
toBibtex(citation("statsgrokse"))
Installation
Stable version from CRAN:
install.packages("statsgrokse")
Latest development version from Github:
devtools::install_github("petermeissner/statsgrokse")
Usage
getting data
The workhorse of the package is the wp_trend() function:
library(statsgrokse)

pageviews <-
  statsgrokse(
    page = "Edward_Snowden",
    from = "2013-06-01",
    to   = "2013-07-31",
    lang = c("en","de")
  )
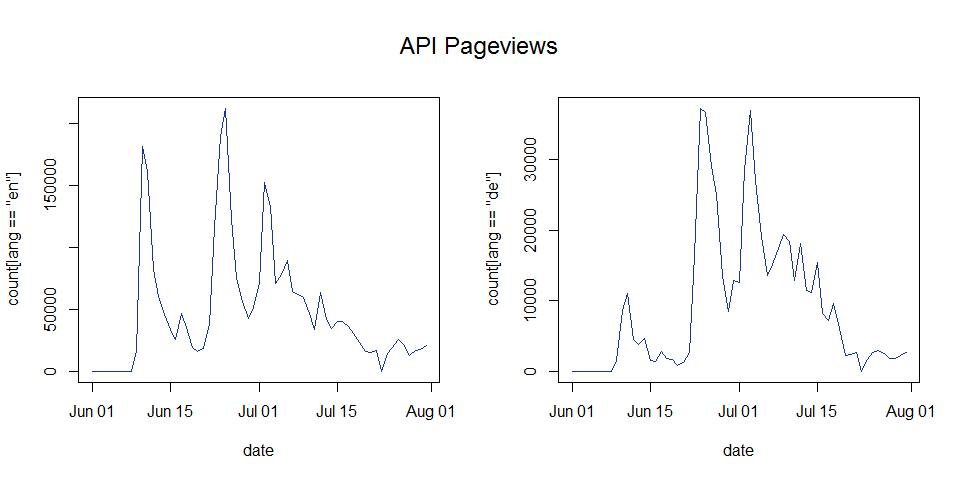
plotting data
pageviews <- pageviews[order(pageviews$lang, pageviews$date), ]

par(mfrow=c(1,2), oma = c(0, 0, 1, 0))

with(
  pageviews,
  {
    plot(date[lang=="en"], count[lang=="en"], type="l", xlab = "date", col="#183691")
    plot(date[lang=="de"], count[lang=="de"], type="l", xlab = "date", col="#183691")
  }
)
mtext("API Pageviews", line=-2, outer = TRUE, cex = 1.5)

par(mfrow=c(1,1), oma=c(0,0,0,0))
petermeissner/statsgrokse documentation built on May 25, 2019, 2 a.m.
R Package Documentation
Browse R Packages
We want your feedback!
Note that we can't provide technical support on individual packages. You should contact the package authors for that.
knitr::opts_chunk$set( collapse = TRUE, comment = "##", fig.path = "README-" )
options("width"=110) tmp <- packageDescription( basename(getwd()) )
cat("#", tmp$Title)
filelist.R <- list.files("R", recursive = TRUE, pattern="\\.R$", ignore.case = TRUE, full.names = TRUE) filelist.tests <- list.files("tests", recursive = TRUE, pattern="\\.R$", ignore.case = TRUE, full.names = TRUE) filelist.cpp <- list.files("src", recursive = TRUE, pattern="\\.cpp$", ignore.case = TRUE, full.names = TRUE) lines.R <- unlist(lapply(filelist.R, readLines)) lines.tests <- unlist(lapply(filelist.tests, readLines)) lines.cpp <- unlist(lapply(filelist.cpp, readLines)) length.R <- length(grep("(^\\s*$)|(^\\s*#)|(^\\s*//)", lines.R, value = TRUE, invert = TRUE)) length.tests <- length(grep("(^\\s*$)|(^\\s*#)|(^\\s*//)", lines.tests, value = TRUE, invert = TRUE)) length.cpp <- length(grep("(^\\s*$)|(^\\s*#)|(^\\s*//)", lines.cpp, value = TRUE, invert = TRUE))
Status

lines of R code: r length.R, lines of test code: r length.tests
Development version
source_files <- grep( "/R/|/src/|/tests/", list.files(recursive = TRUE, full.names = TRUE), value = TRUE ) last_change <- as.character( format(max(file.info(source_files)$mtime), tz="UTC") )
cat(tmp$Version) cat(" - ") cat(stringr::str_replace(last_change, " ", " / "))
Description
cat(tmp$Description)
License
cat(tmp$License, "<br>") cat(tmp$Author)
Citation
citation("statsgrokse")
BibTex for citing
toBibtex(citation("statsgrokse"))
Installation
Stable version from CRAN:
install.packages("statsgrokse")
Latest development version from Github:
devtools::install_github("petermeissner/statsgrokse")
Usage
getting data
The workhorse of the package is the wp_trend() function:
library(statsgrokse) pageviews <- statsgrokse( page = "Edward_Snowden", from = "2013-06-01", to = "2013-07-31", lang = c("en","de") )
plotting data
pageviews <- pageviews[order(pageviews$lang, pageviews$date), ] par(mfrow=c(1,2), oma = c(0, 0, 1, 0)) with( pageviews, { plot(date[lang=="en"], count[lang=="en"], type="l", xlab = "date", col="#183691") plot(date[lang=="de"], count[lang=="de"], type="l", xlab = "date", col="#183691") } ) mtext("API Pageviews", line=-2, outer = TRUE, cex = 1.5) par(mfrow=c(1,1), oma=c(0,0,0,0))
pageviews <- pageviews[order(pageviews$lang, pageviews$date), ] par(mfrow=c(1,2), oma = c(0, 0, 1, 0)) with( pageviews, { plot(date[lang=="en"], count[lang=="en"], type="l", xlab = "date", col="#183691") plot(date[lang=="de"], count[lang=="de"], type="l", xlab = "date", col="#183691") } ) mtext("API Pageviews", line=-2, outer = TRUE, cex = 1.5) par(mfrow=c(1,1), oma=c(0,0,0,0))
R Package Documentation
Browse R Packages
We want your feedback!
Note that we can't provide technical support on individual packages. You should contact the package authors for that.
Embedding an R snippet on your website
Add the following code to your website.
For more information on customizing the embed code, read Embedding Snippets.