In r-tmap/tmap: Thematic Maps
knitr::opts_chunk$set(
  collapse = TRUE,
  fig.width = 8,
  comment = "#>"
)
hook_output <- knitr::knit_hooks$get("output")
knitr::knit_hooks$set(output = function(x, options) {
   lines <- options$output.lines
   if (is.null(lines)) {
     return(hook_output(x, options))  # pass to default hook
   }
   x <- unlist(strsplit(x, "\n"))
   more <- "..."
   if (length(lines)==1) {        # first n lines
     if (length(x) > lines) {
       # truncate the output, but add ....
       x <- c(head(x, lines), more)
     }
   } else {
     x <- c(more, x[lines], more)
   }
   # paste these lines together
   x <- paste(c(x, ""), collapse = "\n")
   hook_output(x, options)
 })
library(tmap)
library(tmap.mapgl)
tmap_options(scale = 0.75)
There are two modes included in tmap: "plot" for static mapping and "view" for interactive mapping. See introduction. The "view" mode uses the JavaScript library Leaflet as backend.
The extension package tmap.mapgl offers two new modes which are also interactive: "mapbox" and "maplibre" which use the JavaScript libraries Mapbox GL and Maplibre GL respectively. An API key is required to use "mapbox" (free for personal use), but "maplibre" is (as the name suggests) free for any use.
Note that tmap.mapgl is a bridge between the R packages mapgl and tmap. It makes the functionality of mapgl (making the JavaScript libraries available to R) also available via the tmap user interface.
For this example we'll create a choropleth of well being per country. We assign the map to map without showing it.
map = tm_shape(World) +
  tm_polygons("well_being",
    fill.scale = tm_scale_continuous(values = "pu_gn"))
tmap_mode("plot")
map
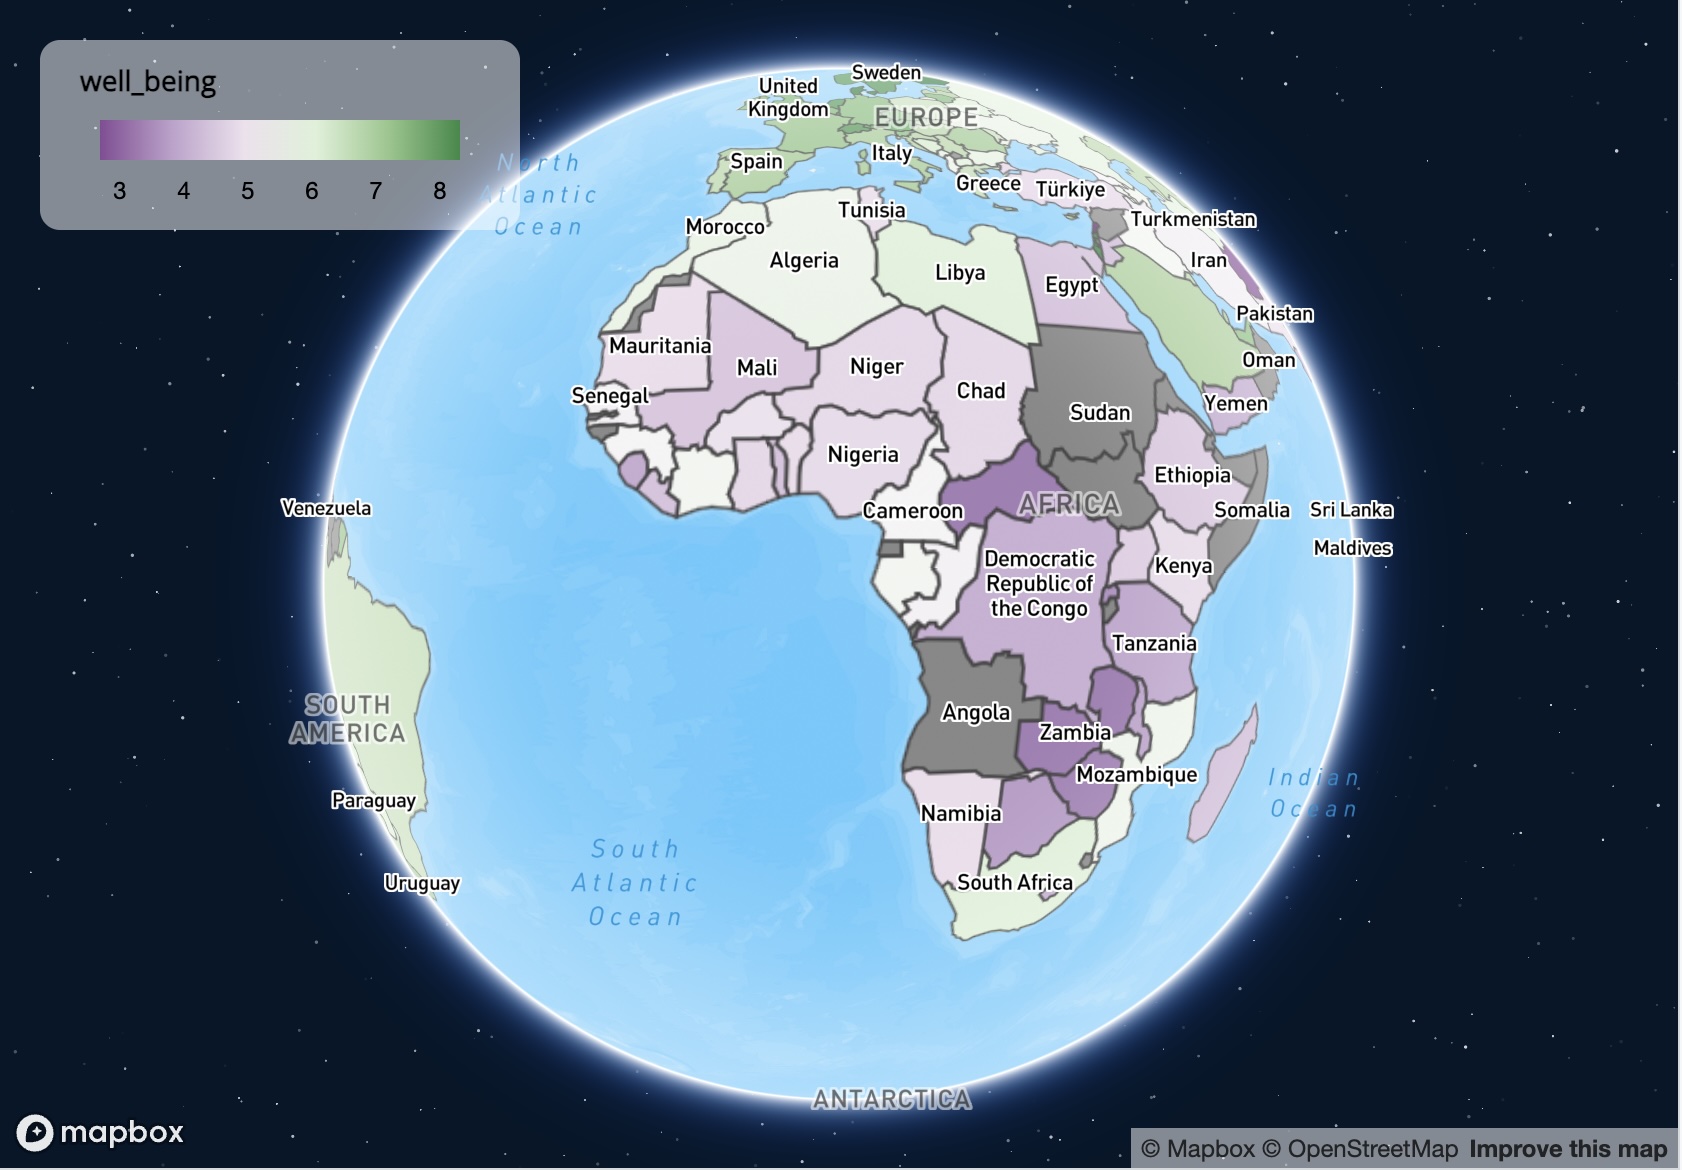
mapbox
For "mapbox" an API key is required, which is free for personal use. See instructions.
library(tmap.mapgl)
tmap_mode("mapbox")
map
maplibre
tmap_mode("maplibre")
map
3d polygons
tmap.mapgl also features a new layer type, tm_polygons_3d, which is only available for "mapbox" and "maplibre".
This map layer is the same as tm_polygons, but one addition: polygons can be extruded in 3d shape. The visual variable to control this is called height.
tmap_mode("maplibre")

NLD_dist$pop_dens = NLD_dist$population / NLD_dist$area

tm_shape(NLD_dist) +
  tm_polygons_3d(height = "pop_dens",
    fill = "edu_appl_sci",
    fill.scale = tm_scale_intervals(style = "kmeans", values = "-pu_gn"),
    fill.legend = tm_legend("Univeristy degree")) +
tm_maplibre(pitch = 45)
r-tmap/tmap documentation built on June 1, 2025, 1:56 p.m.
R Package Documentation
Browse R Packages
We want your feedback!
Note that we can't provide technical support on individual packages. You should contact the package authors for that.
knitr::opts_chunk$set( collapse = TRUE, fig.width = 8, comment = "#>" ) hook_output <- knitr::knit_hooks$get("output") knitr::knit_hooks$set(output = function(x, options) { lines <- options$output.lines if (is.null(lines)) { return(hook_output(x, options)) # pass to default hook } x <- unlist(strsplit(x, "\n")) more <- "..." if (length(lines)==1) { # first n lines if (length(x) > lines) { # truncate the output, but add .... x <- c(head(x, lines), more) } } else { x <- c(more, x[lines], more) } # paste these lines together x <- paste(c(x, ""), collapse = "\n") hook_output(x, options) })
library(tmap) library(tmap.mapgl) tmap_options(scale = 0.75)
There are two modes included in tmap: "plot" for static mapping and "view" for interactive mapping. See introduction. The "view" mode uses the JavaScript library Leaflet as backend.
The extension package tmap.mapgl offers two new modes which are also interactive: "mapbox" and "maplibre" which use the JavaScript libraries Mapbox GL and Maplibre GL respectively. An API key is required to use "mapbox" (free for personal use), but "maplibre" is (as the name suggests) free for any use.
Note that tmap.mapgl is a bridge between the R packages mapgl and tmap. It makes the functionality of mapgl (making the JavaScript libraries available to R) also available via the tmap user interface.
For this example we'll create a choropleth of well being per country. We assign the map to map without showing it.
map = tm_shape(World) + tm_polygons("well_being", fill.scale = tm_scale_continuous(values = "pu_gn"))
tmap_mode("plot") map
mapbox
For "mapbox" an API key is required, which is free for personal use. See instructions.
library(tmap.mapgl) tmap_mode("mapbox") map
maplibre
tmap_mode("maplibre") map
3d polygons
tmap.mapgl also features a new layer type, tm_polygons_3d, which is only available for "mapbox" and "maplibre".
This map layer is the same as tm_polygons, but one addition: polygons can be extruded in 3d shape. The visual variable to control this is called height.
tmap_mode("maplibre") NLD_dist$pop_dens = NLD_dist$population / NLD_dist$area tm_shape(NLD_dist) + tm_polygons_3d(height = "pop_dens", fill = "edu_appl_sci", fill.scale = tm_scale_intervals(style = "kmeans", values = "-pu_gn"), fill.legend = tm_legend("Univeristy degree")) + tm_maplibre(pitch = 45)
R Package Documentation
Browse R Packages
We want your feedback!
Note that we can't provide technical support on individual packages. You should contact the package authors for that.
Embedding an R snippet on your website
Add the following code to your website.
For more information on customizing the embed code, read Embedding Snippets.