README.md
In rCarto/popcircle: Proportional Circles and Shapes
popcircle


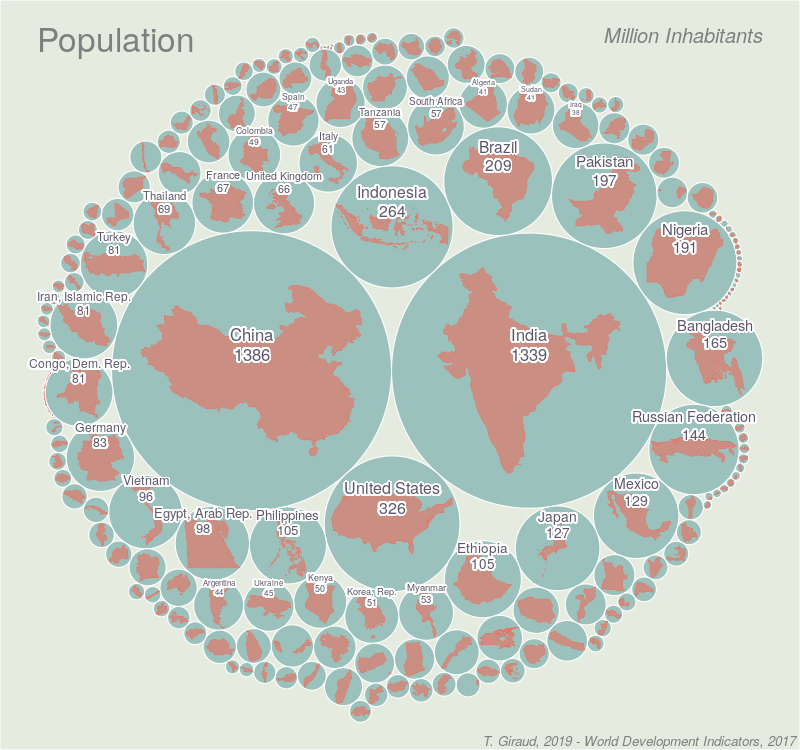
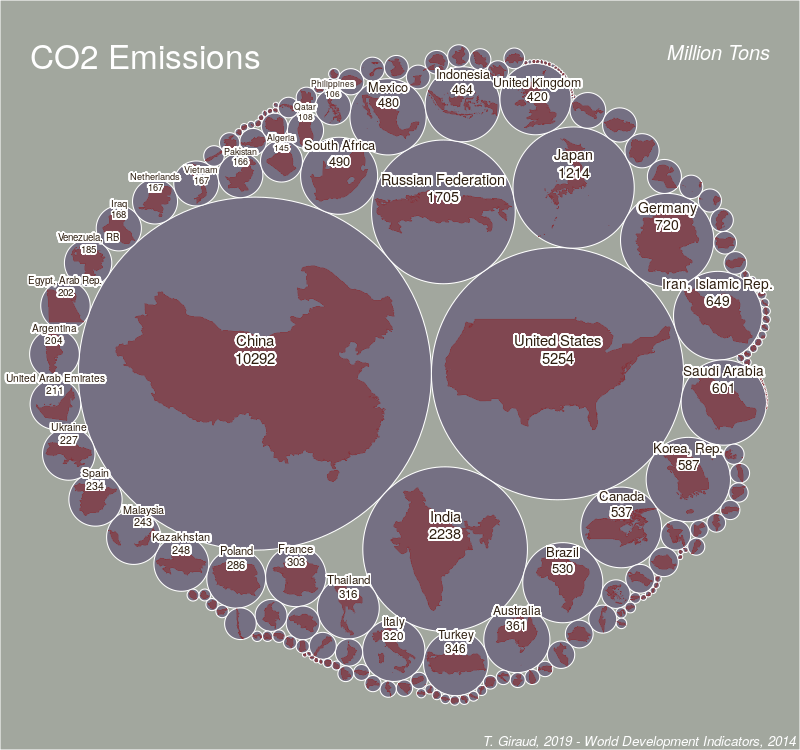
This one-function package computes circles with areas scaled to a variable and displays them using a compact layout (higher values in the center, lower values at the periphery). Original polygons are scaled to fit inside these circles (size are roughly proportional, not strictly).
Install
library(remotes)
install_github("rCarto/popcircle")
Example
See this gist for the code used to produce figures on countries population and CO2 emissions.
Interactive Visualisation
Here is an example of interactive visualisation using leaflet.
Typical example
library(sf)
library(popcircle)
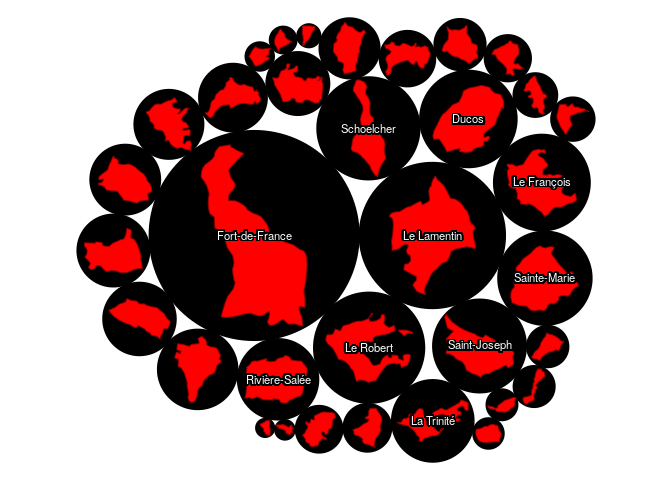
mtq <- st_read(system.file("gpkg/mtq.gpkg", package="popcircle"))
res <- popcircle(x = mtq, var = "POP")
circles <- res$circles
shapes <- res$shapes
par(mar = c(0,0,0,0))
plot(st_geometry(circles), col = "black", border = "black")
plot(st_geometry(shapes), col = "red", add = TRUE, lwd = 1, border = "red4")
if(require(cartography)){
labelLayer(x = circles[1:10,], txt = "LIBGEO", halo = TRUE, overlap = FALSE,
col ="white", bg = "black", r = .15)
}
rCarto/popcircle documentation built on May 3, 2019, 8:36 p.m.
R Package Documentation
Browse R Packages
We want your feedback!
Note that we can't provide technical support on individual packages. You should contact the package authors for that.
popcircle
![]()
This one-function package computes circles with areas scaled to a variable and displays them using a compact layout (higher values in the center, lower values at the periphery). Original polygons are scaled to fit inside these circles (size are roughly proportional, not strictly).
Install
library(remotes)
install_github("rCarto/popcircle")
Example
See this gist for the code used to produce figures on countries population and CO2 emissions.
Interactive Visualisation
Here is an example of interactive visualisation using leaflet.
Typical example
library(sf)
library(popcircle)
mtq <- st_read(system.file("gpkg/mtq.gpkg", package="popcircle"))
res <- popcircle(x = mtq, var = "POP")
circles <- res$circles
shapes <- res$shapes
par(mar = c(0,0,0,0))
plot(st_geometry(circles), col = "black", border = "black")
plot(st_geometry(shapes), col = "red", add = TRUE, lwd = 1, border = "red4")
if(require(cartography)){
labelLayer(x = circles[1:10,], txt = "LIBGEO", halo = TRUE, overlap = FALSE,
col ="white", bg = "black", r = .15)
}
R Package Documentation
Browse R Packages
We want your feedback!
Note that we can't provide technical support on individual packages. You should contact the package authors for that.
Embedding an R snippet on your website
Add the following code to your website.
For more information on customizing the embed code, read Embedding Snippets.