inst/libraries/timeline/example.md
In ramnathv/testapp1: Interactive Charts using Polycharts.js
headline: Financial Time Series
type: default
text: rCharts
startDate: "1998,12,30"
config:
font: "Merriweather-NewsCycle"
startDate: "1998,12,30"
headline: Title 1
text: >
This is some text that i am writing. It can contain arbitrary symbols like :. I dont think it should be a problem
asset:
media: "https://vine.co/v/b55LOA1dgJU"
credit: ""
startDate: "1999,08,27"
headline: ts
text: >
The ts package was added in R version 0.65.0 and significantly improved with release 1.5.0 in April 2002. There is a very good discussion of the improvements in Brian Ripley's "Time Series in R 1.5.0" from Volume 2 of R News, June 2002. plot.ts() added some nice features, such as the ability to plot multiple/wide time series, specify panels per series, and easily calculate acf, ARIMA,and HoltWinters.
asset:
media: "http://timelyportfolio.github.io/rCharts_time_series/assets/fig/unnamed-chunk-5.png"
headline: Lattice, Grid
startDate: "2000,04,29"
text: >
R 1.5.0 was a very important milestone for both graphing and time series analysis with the release of lattice (Deepayan Sarkar) and grid (Paul Murrell) and also the improvements in ts mentioned above., All of these are covered in Volume 2 of R News, June 2002. lattice using grid as its platform began an era of aesthetically pleasing and production-quality graphics straight from R.
headline: Zoo
startDate: "2004,10,28"
text: >
zoo made it easier to work with irregular time series in R and bridged the gap. plot.zoo() allowed us plot.ts() functionality for zoo objects.
asset:
media: "http://timelyportfolio.github.io/rCharts_time_series/assets/fig/unnamed-chunk-7.png"
ramnathv/testapp1 documentation built on May 26, 2019, 10:55 p.m.
R Package Documentation
Browse R Packages
We want your feedback!
Note that we can't provide technical support on individual packages. You should contact the package authors for that.
headline: Financial Time Series type: default text: rCharts startDate: "1998,12,30" config: font: "Merriweather-NewsCycle"
startDate: "1998,12,30" headline: Title 1 text: > This is some text that i am writing. It can contain arbitrary symbols like :. I dont think it should be a problem asset: media: "https://vine.co/v/b55LOA1dgJU" credit: ""
startDate: "1999,08,27"
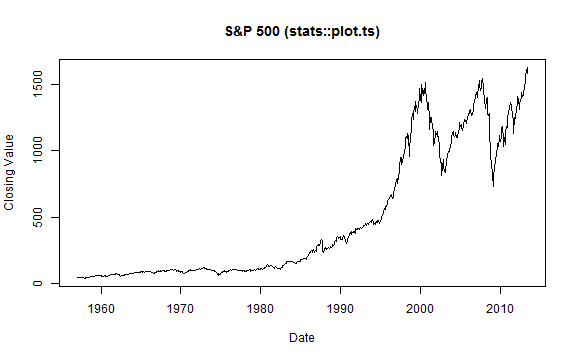
headline: ts
text: >
The ts package was added in R version 0.65.0 and significantly improved with release 1.5.0 in April 2002. There is a very good discussion of the improvements in Brian Ripley's "Time Series in R 1.5.0" from Volume 2 of R News, June 2002. plot.ts() added some nice features, such as the ability to plot multiple/wide time series, specify panels per series, and easily calculate acf, ARIMA,and HoltWinters.
asset:
media: "http://timelyportfolio.github.io/rCharts_time_series/assets/fig/unnamed-chunk-5.png"
headline: Lattice, Grid
startDate: "2000,04,29"
text: >
R 1.5.0 was a very important milestone for both graphing and time series analysis with the release of lattice (Deepayan Sarkar) and grid (Paul Murrell) and also the improvements in ts mentioned above., All of these are covered in Volume 2 of R News, June 2002. lattice using grid as its platform began an era of aesthetically pleasing and production-quality graphics straight from R.
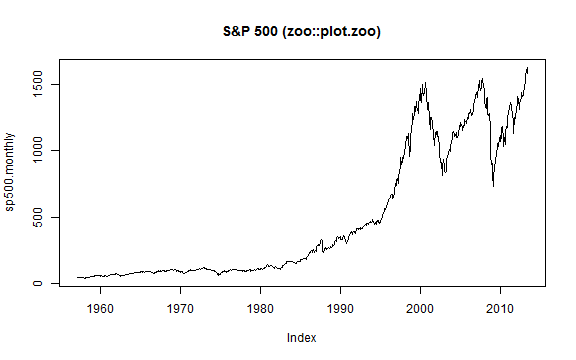
headline: Zoo
startDate: "2004,10,28"
text: >
zoo made it easier to work with irregular time series in R and bridged the gap. plot.zoo() allowed us plot.ts() functionality for zoo objects.
asset:
media: "http://timelyportfolio.github.io/rCharts_time_series/assets/fig/unnamed-chunk-7.png"
R Package Documentation
Browse R Packages
We want your feedback!
Note that we can't provide technical support on individual packages. You should contact the package authors for that.
Embedding an R snippet on your website
Add the following code to your website.
For more information on customizing the embed code, read Embedding Snippets.