scan_data: Thoroughly scan a table to better understand it
In rich-iannone/pointblank: Data Validation and Organization of Metadata for Local and Remote Tables
scan_data R Documentation
Thoroughly scan a table to better understand it
Description
Generate an HTML report that scours the input table data. Before calling up
an agent to validate the data, it's a good idea to understand the data with
some level of precision. Make this the initial step of a well-balanced
data quality reporting workflow. The reporting output contains several
sections to make everything more digestible, and these are:
- Overview
Table dimensions, duplicate row counts, column types, and
reproducibility information
- Variables
A summary for each table variable and further statistics and
summaries depending on the variable type
- Interactions
A matrix plot that shows interactions between variables
- Correlations
A set of correlation matrix plots for numerical
variables
- Missing Values
A summary figure that shows the degree of missingness
across variables
- Sample
A table that provides the head and tail rows of the dataset
The resulting object can be printed to make it viewable in the RStudio
Viewer. It's also a "shiny.tag.list" object and so can be integrated in R
Markdown HTML output or in Shiny applications. If you need the output HTML,
it's to export that to a file with the export_report() function.
Usage
scan_data(
  tbl,
  sections = "OVICMS",
  navbar = TRUE,
  width = NULL,
  lang = NULL,
  locale = NULL
)
Arguments
tbl
A data table
obj:<tbl_*> // required
The input table. This can be a data frame, tibble, a tbl_dbi object, or a
tbl_spark object.
sections
Sections to include
scalar<character> // default: "OVICMS"
The sections to include in the finalized Table Scan report. A string with
key characters representing section names is required here. The default
string is "OVICMS" wherein each letter stands for the following sections
in their default order: "O": "overview"; "V": "variables"; "I":
"interactions"; "C": "correlations"; "M": "missing"; and "S":
"sample". This string can be comprised of less characters and the order
can be changed to suit the desired layout of the report. For tbl_dbi and
tbl_spark objects supplied to tbl, the "interactions" and
"correlations" sections are currently excluded.
navbar
Include navigation in HTML report
scalar<logical> // default: TRUE
Should there be a navigation bar anchored to the top of the report page?
width
Width option for HTML report
scalar<integer> // default: NULL (optional)
An optional fixed width (in pixels) for the HTML report. By default, no
fixed width is applied.
lang
Reporting language
scalar<character> // default: NULL (optional)
The language to use for label text in the report. By default, NULL will
create English ("en") text. Other options include French ("fr"), German
("de"), Italian ("it"), Spanish ("es"), Portuguese ("pt"), Turkish
("tr"), Chinese ("zh"), Russian ("ru"), Polish ("pl"), Danish
("da"), Swedish ("sv"), and Dutch ("nl").
locale
Locale for value formatting within reports
scalar<character> // default: NULL (optional)
An optional locale ID to use for formatting values in the report according
the locale's rules. Examples include "en_US" for English (United States)
and "fr_FR" for French (France); more simply, this can be a language
identifier without a country designation, like "es" for Spanish (Spain,
same as "es_ES").
Value
A ptblank_tbl_scan object.
Examples
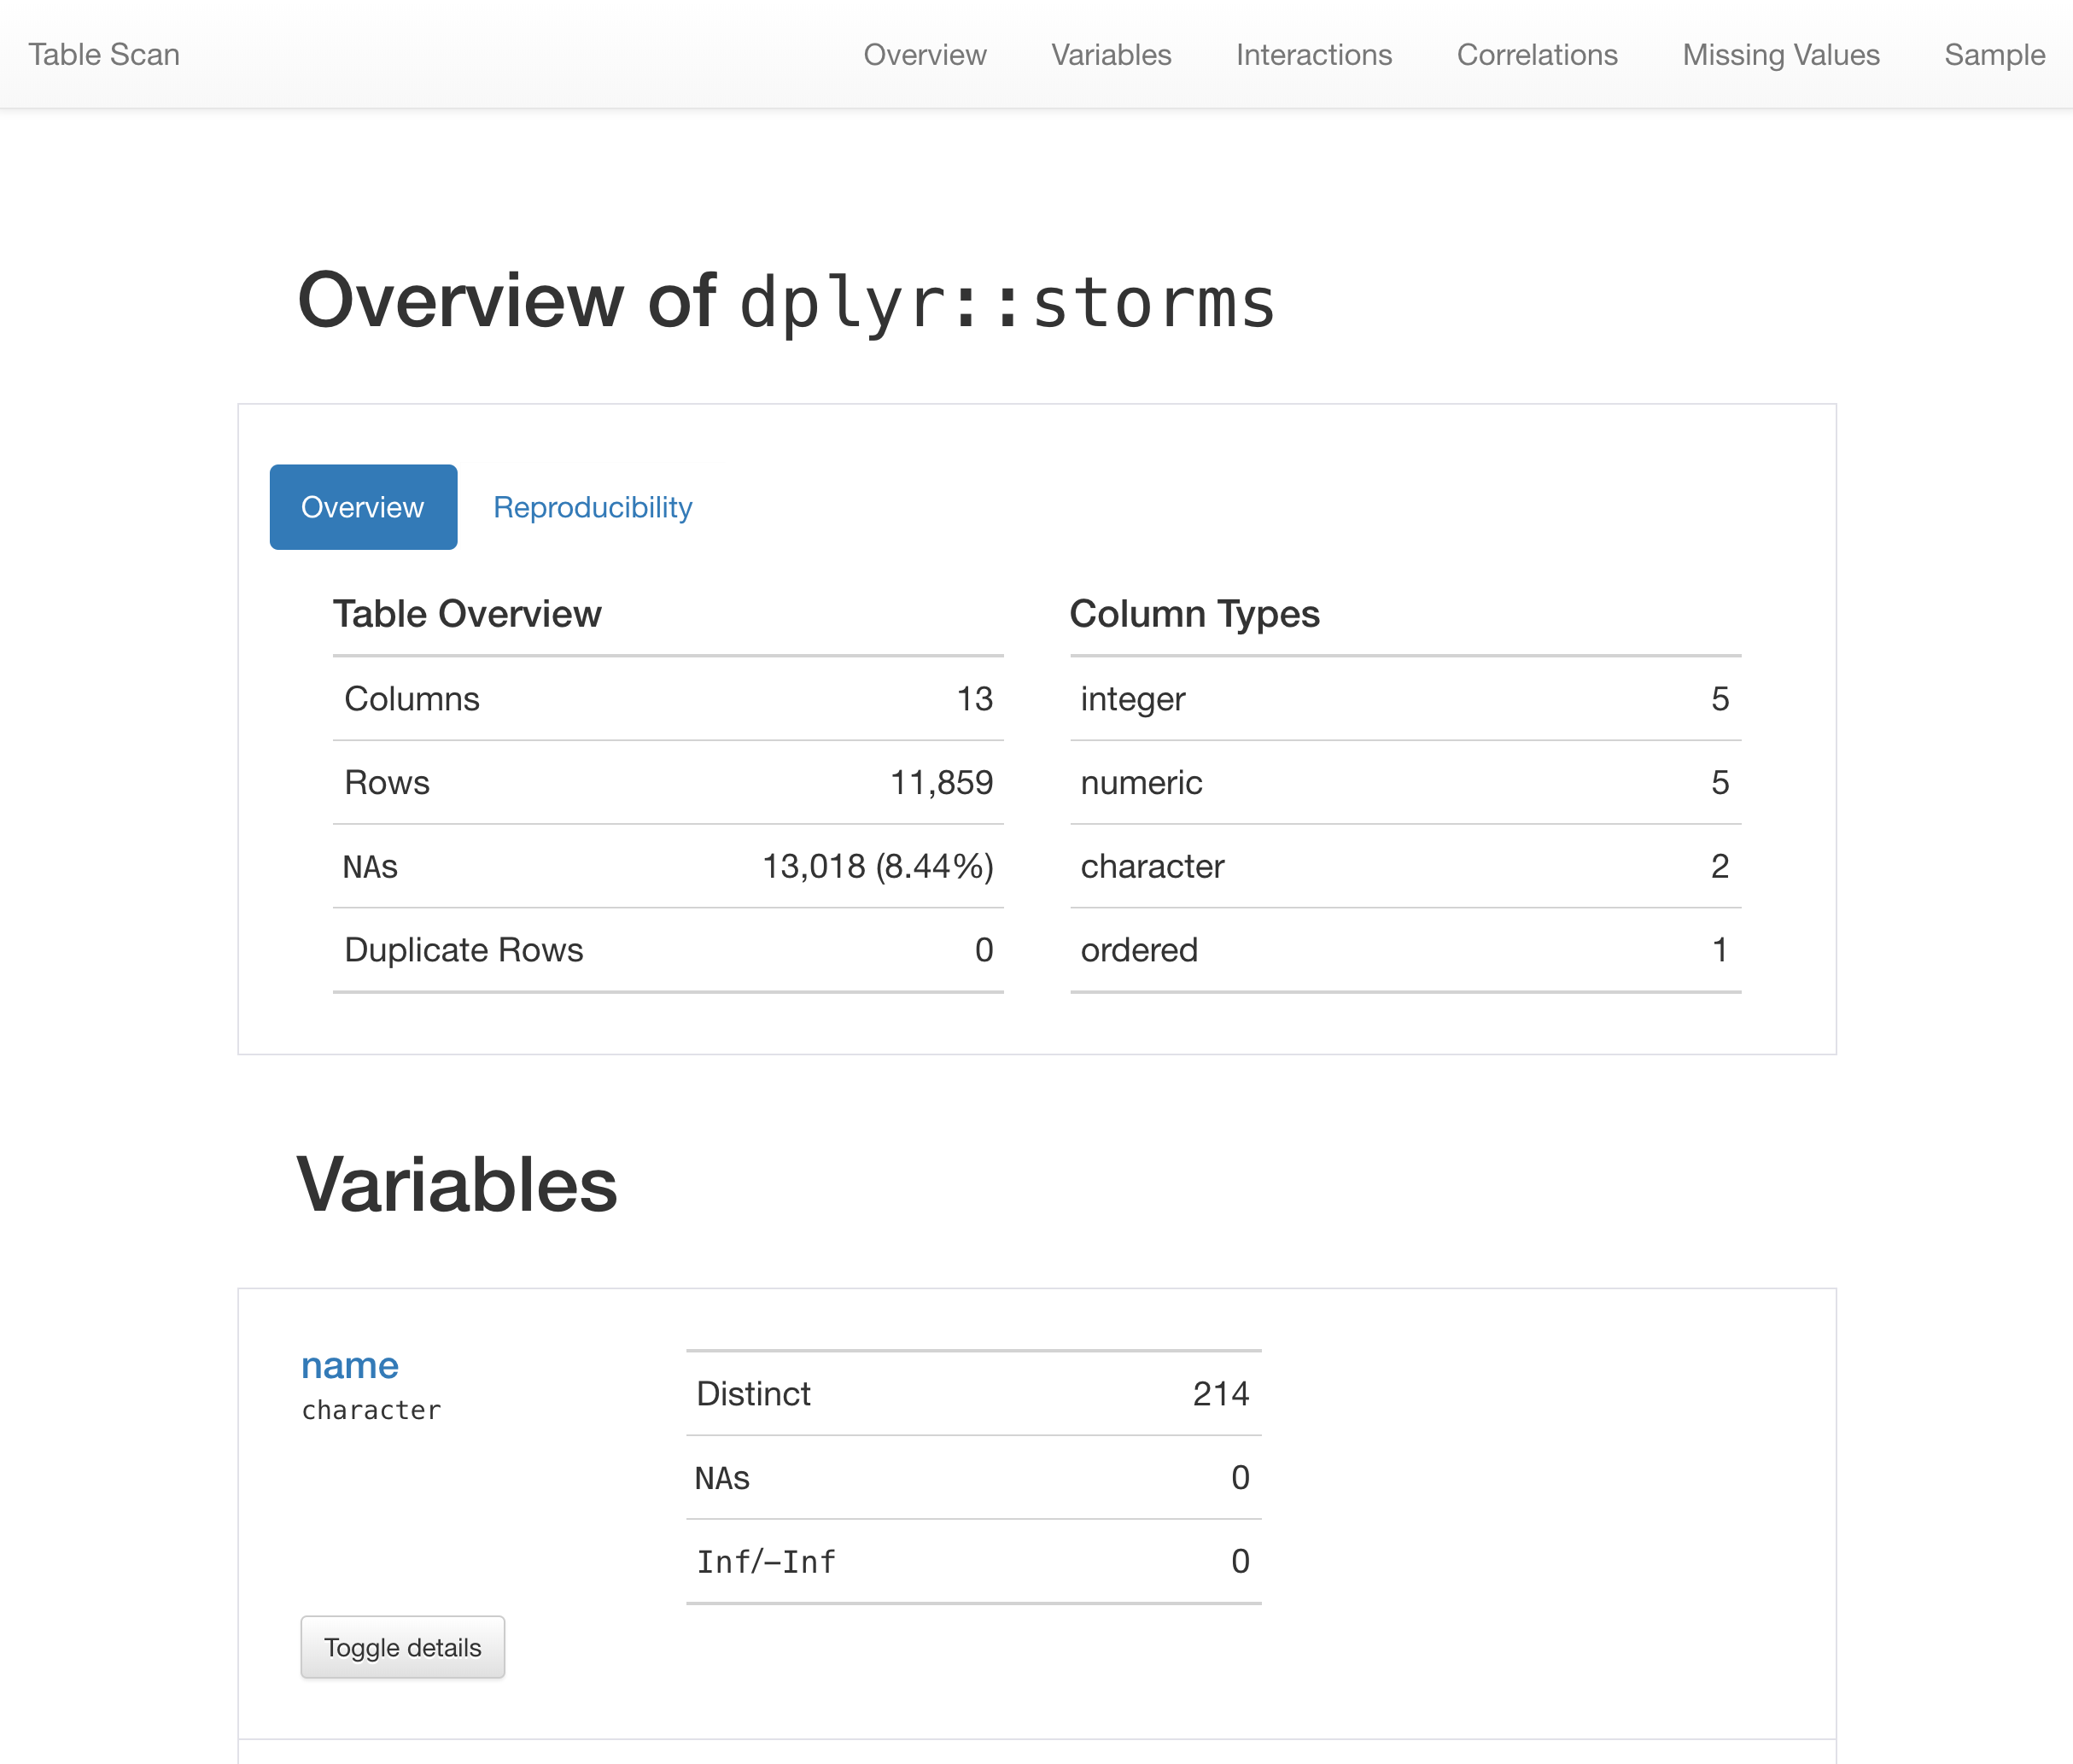
Get an HTML document that describes all of the data in the dplyr::storms
dataset.
tbl_scan <- scan_data(tbl = dplyr::storms)
Function ID
1-1
See Also
Other Planning and Prep:
action_levels(),
create_agent(),
create_informant(),
db_tbl(),
draft_validation(),
file_tbl(),
tbl_get(),
tbl_source(),
tbl_store(),
validate_rmd()
rich-iannone/pointblank documentation built on June 29, 2024, 4:09 p.m.
R Package Documentation
Browse R Packages
We want your feedback!
Note that we can't provide technical support on individual packages. You should contact the package authors for that.
| scan_data | R Documentation |
Thoroughly scan a table to better understand it
Description
Generate an HTML report that scours the input table data. Before calling up an agent to validate the data, it's a good idea to understand the data with some level of precision. Make this the initial step of a well-balanced data quality reporting workflow. The reporting output contains several sections to make everything more digestible, and these are:
- Overview
Table dimensions, duplicate row counts, column types, and reproducibility information
- Variables
A summary for each table variable and further statistics and summaries depending on the variable type
- Interactions
A matrix plot that shows interactions between variables
- Correlations
A set of correlation matrix plots for numerical variables
- Missing Values
A summary figure that shows the degree of missingness across variables
- Sample
A table that provides the head and tail rows of the dataset
The resulting object can be printed to make it viewable in the RStudio
Viewer. It's also a "shiny.tag.list" object and so can be integrated in R
Markdown HTML output or in Shiny applications. If you need the output HTML,
it's to export that to a file with the export_report() function.
Usage
scan_data(
tbl,
sections = "OVICMS",
navbar = TRUE,
width = NULL,
lang = NULL,
locale = NULL
)
Arguments
tbl |
A data table
The input table. This can be a data frame, tibble, a |
sections |
Sections to include
The sections to include in the finalized |
navbar |
Include navigation in HTML report
Should there be a navigation bar anchored to the top of the report page? |
width |
Width option for HTML report
An optional fixed width (in pixels) for the HTML report. By default, no fixed width is applied. |
lang |
Reporting language
The language to use for label text in the report. By default, |
locale |
Locale for value formatting within reports
An optional locale ID to use for formatting values in the report according
the locale's rules. Examples include |
Value
A ptblank_tbl_scan object.
Examples
Get an HTML document that describes all of the data in the dplyr::storms
dataset.
tbl_scan <- scan_data(tbl = dplyr::storms)
Function ID
1-1
See Also
Other Planning and Prep:
action_levels(),
create_agent(),
create_informant(),
db_tbl(),
draft_validation(),
file_tbl(),
tbl_get(),
tbl_source(),
tbl_store(),
validate_rmd()
R Package Documentation
Browse R Packages
We want your feedback!
Note that we can't provide technical support on individual packages. You should contact the package authors for that.
Embedding an R snippet on your website
Add the following code to your website.
For more information on customizing the embed code, read Embedding Snippets.