In ropensci/stats19: Work with Open Road Traffic Casualty Data from Great Britain
background-image: url(https://user-images.githubusercontent.com/1825120/61066243-12dc6d80-a3fd-11e9-8805-826a47c553f6.png)
About the course team and location
- Robin Lovelace
- Haruko
- Pangiotis
- Martyna
About the course
- What it is...
- An opportunity to learn R with support
- Based on recent, cutting edge software
- By people experienced teachers/researchers/developers
--
- What it is not
- A course on statistical modelling
About the package
See https://docs.ropensci.org/stats19/
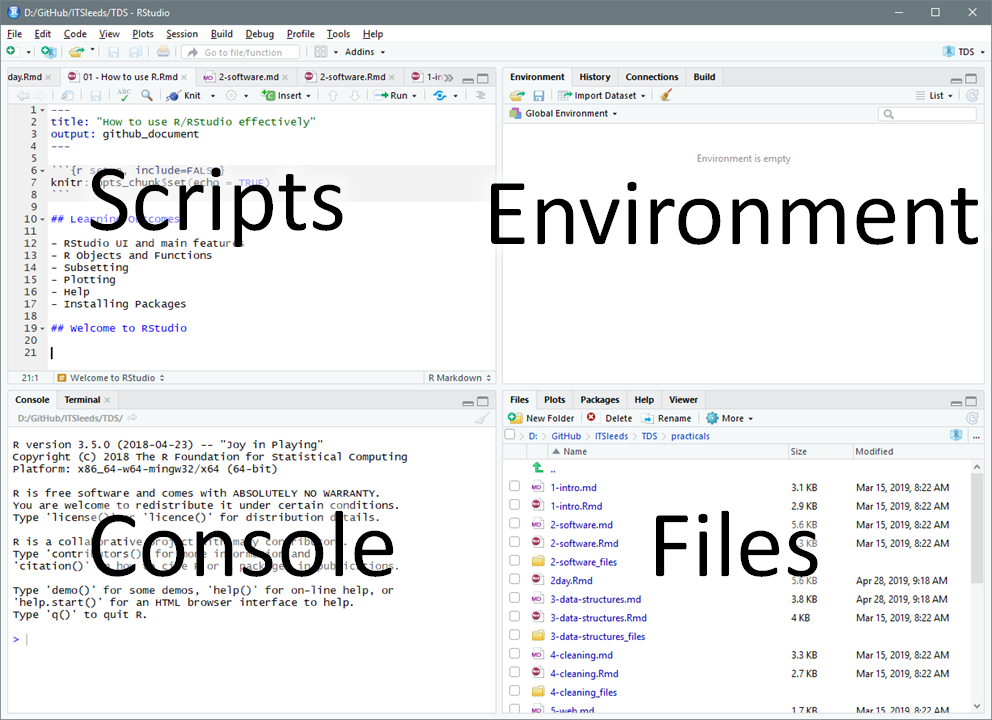
R and RStudio demo
Actions speak louder than words...
Over to you
Work through Section 2 of the exercises
- Projects and scripts
- Writing and running code
- Vewing Objects
- Autocompletion
- Getting help
Time data
Section 3.4 shows how to change classes in R
Time is represented by special classes:
library(lubridate)
x = today()
class(x)
day(x)
month(x)
year(x)
weekdays(x)
Time representations
as.Date("2019-10-17") # works
# as.Date("2019 10 17") # fails
ymd("2019 10 17") # works
dmy("17/10/2019") # works
Subsetting time objects
c_sample = stats19::accidents_sample
c_sample$date
c_sample$date_formatted = dmy(c_sample$date)
c_sample$date_formatted > ymd("2022-08-01")
Next up
- Try running the code and answer the questions in Section 5
- Continue working through Sections 2 and 3
After lunch
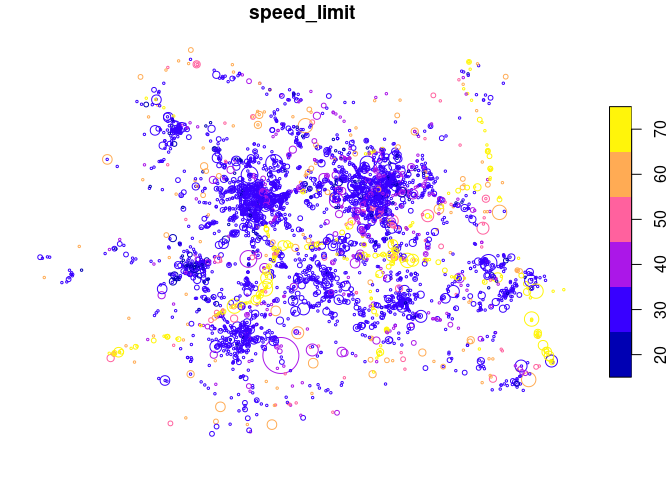
Spatial data (maps!)
Spatial data and maps
library(sf)
crashes = readr::read_csv("https://github.com/ropensci/stats19/releases/download/1.0.0/crashes.csv")
crashes_sf = crashes # create copy of crashes dataset
crashes_sf$longitude = c(-1.3, -1.2, -1.1)
crashes_sf$latitude = c(50.7, 50.7, 50.68)
crashes_sf = st_as_sf(crashes_sf, coords = c("longitude", "latitude"), crs = 4326)
plot(crashes_sf)
Doing spatial data with R
- Context: spatial ecosystem (see section 1.4 of Geocomputation with R - package ecosystem)
-
Exercises: Section 6 of the handout
-
Further reading: Section 3.2 to 3.2.2 of handouts
Practical
- Work through Section 6.1 and try exercises 1 to 3
- Take a short read of Section 1.4 of Geocomputation with R (first challenge, find the resource online!)
- Return to the practical
Afternoon session
-
Talk on Road Safety 1
-
Applying the methods to stats19 data - live demo
How to access data with stats19
Key stats19 functions
Excercises: analysing road crash data on the Isle of Wight
-
Continue working through the handouts
- Talk on Road Safety 2
- Homework - ensure that you have at least read-over the handout Sections 1:5
Day 2
- Prioirty: consolidate knowledge from day 1
- Continuing to work through the handouts starting on Section 6
- Demonstrations of counting number of crashes on roads
- Talk on network analysis
- Talk on R in a professional setting
- Working on your own data
--
- Missed homework! Ensure that you have at least read-over the handout Sections 1:5
The R learning curve
See video: https://www.youtube.com/watch?v=7oyiPBjLAWY&feature=youtu.be&t=357

Agenda
09:30-11:00 Point pattern analysis
- Visualising data with tmap
- Spatial and temporal subsetting
- Aggregation
11:15-12:30 Road network data
- Desire lines: using origin-destination data
- Downloading road network data from OSM
- Buffers on road networks
Lunch
13:30-15:00 Analysing crash data on road network
Break
15:15-15:30: Talk on Road Safety 3
15:30-16:30 Applying the methods to your own data
Bonus extras

--
Merging, forecasting, network analysis
Visualising spatial data practical
- Foundations of sf: try Sections 6.2 and 6.3 (building on new subsetting knowledge)
-
Making maps: try out the exercises in Section 7
-
From break until lunch, either:
- Continue working through the practicals (Sections 2 to 5), or
-
Dive into processing large stats19 dataset (Section 8)
-
Sections 1:5 R vital
- Section 3 on subsetting (vital)
- Section 4 on packages (important)
- Section 5 on times (can do later)
--
- Live demo + questions
Further information
ropensci/stats19 documentation built on Jan. 14, 2025, 6:34 p.m.
R Package Documentation
Browse R Packages
We want your feedback!
Note that we can't provide technical support on individual packages. You should contact the package authors for that.
background-image: url(https://user-images.githubusercontent.com/1825120/61066243-12dc6d80-a3fd-11e9-8805-826a47c553f6.png)
About the course team and location
- Robin Lovelace
- Haruko
- Pangiotis
- Martyna
About the course
- What it is...
- An opportunity to learn R with support
- Based on recent, cutting edge software
- By people experienced teachers/researchers/developers
--
- What it is not
- A course on statistical modelling
About the package
See https://docs.ropensci.org/stats19/
R and RStudio demo
Actions speak louder than words...
Over to you
Work through Section 2 of the exercises
- Projects and scripts
- Writing and running code
- Vewing Objects
- Autocompletion
- Getting help
Time data
Section 3.4 shows how to change classes in R
Time is represented by special classes:
library(lubridate) x = today() class(x) day(x) month(x) year(x) weekdays(x)
Time representations
as.Date("2019-10-17") # works # as.Date("2019 10 17") # fails ymd("2019 10 17") # works dmy("17/10/2019") # works
Subsetting time objects
c_sample = stats19::accidents_sample c_sample$date c_sample$date_formatted = dmy(c_sample$date) c_sample$date_formatted > ymd("2022-08-01")
Next up
- Try running the code and answer the questions in Section 5
- Continue working through Sections 2 and 3
After lunch
Spatial data (maps!)
Spatial data and maps
library(sf) crashes = readr::read_csv("https://github.com/ropensci/stats19/releases/download/1.0.0/crashes.csv") crashes_sf = crashes # create copy of crashes dataset crashes_sf$longitude = c(-1.3, -1.2, -1.1) crashes_sf$latitude = c(50.7, 50.7, 50.68) crashes_sf = st_as_sf(crashes_sf, coords = c("longitude", "latitude"), crs = 4326) plot(crashes_sf)
Doing spatial data with R
- Context: spatial ecosystem (see section 1.4 of Geocomputation with R - package ecosystem)
-
Exercises: Section 6 of the handout
-
Further reading: Section 3.2 to 3.2.2 of handouts
Practical
- Work through Section 6.1 and try exercises 1 to 3
- Take a short read of Section 1.4 of Geocomputation with R (first challenge, find the resource online!)
- Return to the practical
Afternoon session
-
Talk on Road Safety 1
-
Applying the methods to stats19 data - live demo
How to access data with stats19 Key stats19 functions Excercises: analysing road crash data on the Isle of Wight
-
Continue working through the handouts
- Talk on Road Safety 2
- Homework - ensure that you have at least read-over the handout Sections 1:5
Day 2
- Prioirty: consolidate knowledge from day 1
- Continuing to work through the handouts starting on Section 6
- Demonstrations of counting number of crashes on roads
- Talk on network analysis
- Talk on R in a professional setting
- Working on your own data
--
- Missed homework! Ensure that you have at least read-over the handout Sections 1:5
The R learning curve
See video: https://www.youtube.com/watch?v=7oyiPBjLAWY&feature=youtu.be&t=357
Agenda
09:30-11:00 Point pattern analysis
- Visualising data with tmap
- Spatial and temporal subsetting
- Aggregation
11:15-12:30 Road network data
- Desire lines: using origin-destination data
- Downloading road network data from OSM
- Buffers on road networks
Lunch
13:30-15:00 Analysing crash data on road network
Break
15:15-15:30: Talk on Road Safety 3
15:30-16:30 Applying the methods to your own data
Bonus extras
--
Merging, forecasting, network analysis
Visualising spatial data practical
- Foundations of sf: try Sections 6.2 and 6.3 (building on new subsetting knowledge)
-
Making maps: try out the exercises in Section 7
-
From break until lunch, either:
- Continue working through the practicals (Sections 2 to 5), or
-
Dive into processing large stats19 dataset (Section 8)
-
Sections 1:5 R vital
- Section 3 on subsetting (vital)
- Section 4 on packages (important)
- Section 5 on times (can do later)
--
- Live demo + questions
Further information
R Package Documentation
Browse R Packages
We want your feedback!
Note that we can't provide technical support on individual packages. You should contact the package authors for that.
Embedding an R snippet on your website
Add the following code to your website.
For more information on customizing the embed code, read Embedding Snippets.