In ropensci/stats19: Work with Open Road Traffic Casualty Data from Great Britain
background-image: url(https://www.jato.com/wp-content/uploads/2019/11/Chart-4-1024x401.jpg)
--
# to reproduce these slides do:
pkgs = c("rgdal", "sf", "geojsonsf")
install.packages(pkgs)
--
options(htmltools.dir.version = FALSE)
# get ods data
if(!file.exists("veh0105.ods")) {
  download.file("https://assets.publishing.service.gov.uk/government/uploads/system/uploads/attachment_data/file/830778/veh0101.ods", "veh0101.ods")
  download.file("https://assets.publishing.service.gov.uk/government/uploads/system/uploads/attachment_data/file/794455/veh0103.ods", "veh0103.ods")
  download.file("https://assets.publishing.service.gov.uk/government/uploads/system/uploads/attachment_data/file/830779/veh0104.ods", "veh0104.ods")
  download.file("https://assets.publishing.service.gov.uk/government/uploads/system/uploads/attachment_data/file/794433/veh0105.ods", "veh0105.ods")
  download.file("https://assets.publishing.service.gov.uk/government/uploads/system/uploads/attachment_data/file/830786/veh0128.ods", "veh0128.ods")
}
# veh0101 = readODS::read.ods("veh0101.ods")
# veh0103 = readODS::read.ods("veh0103.ods")
# veh0104 = readODS::read.ods("veh0104.ods")
# veh0105 = readODS::read.ods("veh0105.ods")
# veh0128 = readODS::read.ods("veh0128.ods")
library(tidyverse)
veh0128 = readr::read_csv("https://github.com/ropensci/stats19/releases/download/1.1.0/veh0128.csv")
veh_names = "QASHQAI|fiesta")
veh0128_sub = veh0128 %>%
  filter(str_match(string = `Generic model 1`, veh_names))
--
Source Jato: SUVs make up 40% of total car registrations
--
???
background-image: url(https://cdn1.carbuyer.co.uk/sites/carbuyer_d7/files/styles/insert_main_wide_image/public/car_images/peugeot_3008_cutout_best_mid_suv_2019bestbuys.jpg?itok=GMiNNkDy)
--
Largely unnoticed
In tax band E, D or even A - C for electrics

Defining SUVs
.pull-left[
No standard definition
- In USA: "rugged automotive vehicle similar to a station wagon but built on a light-truck chassis"
- In UK: "powerful vehicle with four-wheel drive that can be driven over rough ground. The abbreviation SUV is often used."
]
.pull-right[
Data on weight and height is hard to come by
https://www.epa.gov/compliance-and-fuel-economy-data/data-cars-used-testing-fuel-economy
MOT data excludes weight: https://www.gov.uk/transport/car-motorcycle-and-van-mot-tests
But we do have good data on tax band
]
Suggestion: define on weight (energy, size) + height (colision height)
background-image: url(https://informedforlife.org/demos/FCKeditor/UserFiles/Image/weight%20graph%20with%20ave.%20passenger%20vehicle.png)
Source https://www.bogleheads.org/forum/viewtopic.php?t=281280
???
Previously my cars have always been midsize sedans. Chevrolets, Mazdas, etc. My intent was and may be still to purchase a more economical commuter. I test drove a Civic, Accord, Elantra, Sonata, Camry, Mazda3, Mazda6, Corolla, and Camry. I'm nothing if not thorough about figuring this out. I've noticed a huge uptick in the average size of vehicles around me during my 2 hours of round trip commuting each day (this is a newer job).
I really noticed this from the drivers seat of a Honda Civic. It seems like only about 10% of the vehicles in my area are actual cars anymore. Pickups, SUVs, Crossovers, Minivans. I never used to feel like safety was a major concern in a smaller vehicle, but it just seems like in the event of a crash I would be much more likely to be on the... squished... end of the accident. Is this unreasonable?
Huge cobenefits of downsizing
knitr::include_graphics("https://royalsocietypublishing.org/cms/attachment/6cf8790d-1cc3-4e01-b140-e913718b3f2e/rsta20160364f03.jpg")
Serrenho et al (2022) The impact of reducing car weight on global emissions: the future fleet in Great Britain https://doi.org/10.1098/rsta.2016.0364
???
2008 book by Scott Burkun aimed at software architects
Too techy for me, about managing 100s of people!
A Sport Utility Vehicle for the 21st Century
Source: Quicab
- Slower
- Lighter
- Physical activity
- Better air quality
--
Saves lives
???
2015 book by Daniel Levitin
Too techy for me, about managing 100s of people!
.pull-left[
knitr::include_graphics("https://ec.europa.eu/easme/sites/easme-site/files/getreal_growinggap_e_year2022.jpg")
]
--
.pull-right[
Real world emissions have diverged
EU tests show size of gap
See the Get Real report
]
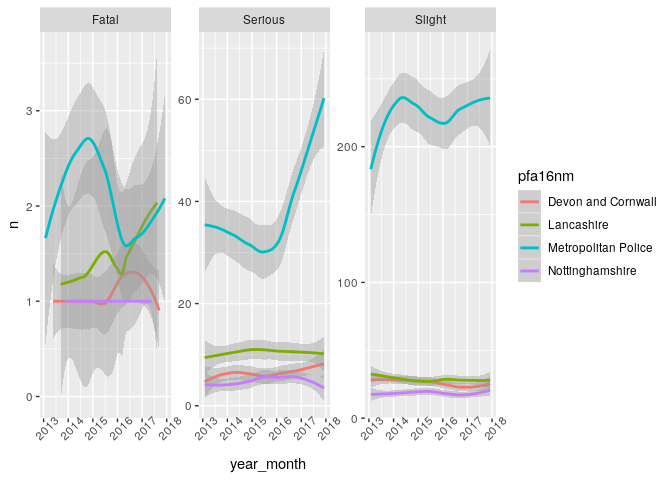
Road crash data
From open STATS19 data (stats19 R package)

Next steps
 .pull-left[
Crash data vs size (engine + tax data)
]
--
.pull-right[
Estimate potential lives saved
]
class: center, middle
Thanks!
Contact me at r. lovelace at leeds ac dot uk (email), @robinlovelace (twitter + github)
--
Check-out my repos at https://github.com/robinlovelace/
--
For more information on stats19 data, see stats19 on GitHub
--
Thanks to all the R developers who made this possible, including (for this presentation):
remark.js, knitr, and R Markdown.
Slides created via the R package xaringan.
--
Thanks to everyone for building a open and collaborative communities!
ropensci/stats19 documentation built on Jan. 14, 2025, 6:34 p.m.
R Package Documentation
Browse R Packages
We want your feedback!
Note that we can't provide technical support on individual packages. You should contact the package authors for that.
background-image: url(https://www.jato.com/wp-content/uploads/2019/11/Chart-4-1024x401.jpg)
--
# to reproduce these slides do: pkgs = c("rgdal", "sf", "geojsonsf") install.packages(pkgs)
--
options(htmltools.dir.version = FALSE)
# get ods data if(!file.exists("veh0105.ods")) { download.file("https://assets.publishing.service.gov.uk/government/uploads/system/uploads/attachment_data/file/830778/veh0101.ods", "veh0101.ods") download.file("https://assets.publishing.service.gov.uk/government/uploads/system/uploads/attachment_data/file/794455/veh0103.ods", "veh0103.ods") download.file("https://assets.publishing.service.gov.uk/government/uploads/system/uploads/attachment_data/file/830779/veh0104.ods", "veh0104.ods") download.file("https://assets.publishing.service.gov.uk/government/uploads/system/uploads/attachment_data/file/794433/veh0105.ods", "veh0105.ods") download.file("https://assets.publishing.service.gov.uk/government/uploads/system/uploads/attachment_data/file/830786/veh0128.ods", "veh0128.ods") } # veh0101 = readODS::read.ods("veh0101.ods") # veh0103 = readODS::read.ods("veh0103.ods") # veh0104 = readODS::read.ods("veh0104.ods") # veh0105 = readODS::read.ods("veh0105.ods") # veh0128 = readODS::read.ods("veh0128.ods") library(tidyverse) veh0128 = readr::read_csv("https://github.com/ropensci/stats19/releases/download/1.1.0/veh0128.csv") veh_names = "QASHQAI|fiesta") veh0128_sub = veh0128 %>% filter(str_match(string = `Generic model 1`, veh_names))
--
Source Jato: SUVs make up 40% of total car registrations
--
???
background-image: url(https://cdn1.carbuyer.co.uk/sites/carbuyer_d7/files/styles/insert_main_wide_image/public/car_images/peugeot_3008_cutout_best_mid_suv_2019bestbuys.jpg?itok=GMiNNkDy)
--
Largely unnoticed
In tax band E, D or even A - C for electrics
Defining SUVs
.pull-left[
No standard definition
- In USA: "rugged automotive vehicle similar to a station wagon but built on a light-truck chassis"
- In UK: "powerful vehicle with four-wheel drive that can be driven over rough ground. The abbreviation SUV is often used." ]
.pull-right[
Data on weight and height is hard to come by
https://www.epa.gov/compliance-and-fuel-economy-data/data-cars-used-testing-fuel-economy
MOT data excludes weight: https://www.gov.uk/transport/car-motorcycle-and-van-mot-tests
But we do have good data on tax band
]
Suggestion: define on weight (energy, size) + height (colision height)
background-image: url(https://informedforlife.org/demos/FCKeditor/UserFiles/Image/weight%20graph%20with%20ave.%20passenger%20vehicle.png)
Source https://www.bogleheads.org/forum/viewtopic.php?t=281280
???
Previously my cars have always been midsize sedans. Chevrolets, Mazdas, etc. My intent was and may be still to purchase a more economical commuter. I test drove a Civic, Accord, Elantra, Sonata, Camry, Mazda3, Mazda6, Corolla, and Camry. I'm nothing if not thorough about figuring this out. I've noticed a huge uptick in the average size of vehicles around me during my 2 hours of round trip commuting each day (this is a newer job).
I really noticed this from the drivers seat of a Honda Civic. It seems like only about 10% of the vehicles in my area are actual cars anymore. Pickups, SUVs, Crossovers, Minivans. I never used to feel like safety was a major concern in a smaller vehicle, but it just seems like in the event of a crash I would be much more likely to be on the... squished... end of the accident. Is this unreasonable?
Huge cobenefits of downsizing
knitr::include_graphics("https://royalsocietypublishing.org/cms/attachment/6cf8790d-1cc3-4e01-b140-e913718b3f2e/rsta20160364f03.jpg")
Serrenho et al (2022) The impact of reducing car weight on global emissions: the future fleet in Great Britain https://doi.org/10.1098/rsta.2016.0364
???
2008 book by Scott Burkun aimed at software architects
Too techy for me, about managing 100s of people!
A Sport Utility Vehicle for the 21st Century
Source: Quicab
- Slower
- Lighter
- Physical activity
- Better air quality
--
Saves lives
???
2015 book by Daniel Levitin
Too techy for me, about managing 100s of people!
.pull-left[
knitr::include_graphics("https://ec.europa.eu/easme/sites/easme-site/files/getreal_growinggap_e_year2022.jpg")
]
--
.pull-right[
Real world emissions have diverged
EU tests show size of gap
See the Get Real report
]
Road crash data
From open STATS19 data (stats19 R package)
Next steps
.pull-left[
Crash data vs size (engine + tax data)
]
--
.pull-right[
Estimate potential lives saved
]
class: center, middle
Thanks!
Contact me at r. lovelace at leeds ac dot uk (email), @robinlovelace (twitter + github)
--
Check-out my repos at https://github.com/robinlovelace/
--
For more information on stats19 data, see stats19 on GitHub
--
Thanks to all the R developers who made this possible, including (for this presentation):
remark.js, knitr, and R Markdown.
Slides created via the R package xaringan.
--
Thanks to everyone for building a open and collaborative communities!
R Package Documentation
Browse R Packages
We want your feedback!
Note that we can't provide technical support on individual packages. You should contact the package authors for that.
Embedding an R snippet on your website
Add the following code to your website.
For more information on customizing the embed code, read Embedding Snippets.