README.md
In royr2/plotlyvis: Create visually appealing charts using Plotly's R-API (plotly package) with an easy to use interface
plotlyvis
An R package aimed at providing a base plot() like interface to create presentation quality interactive charts in R using Plotly's R API. The package builds on Carson Sievert's plotly package.
I personally like the plot_ly() interface better and more flexible to use. This package aims to provide some standard layouts, color schemes and annotation blocks to help lower the effort needed to build a visually appealing / presentation worthy chart.
Please note that this is very much a work in progress and I hope to build out its functionality in the next few months. This is my very first R-package so any comments / suggestions are very much welcome.
Why another package?
If you are an analyst like me, you are probably juggling a lot of different things at the same time all the while trying to optimize on time.
While it is fun and insightful to write something like this:
library(plotly)
set.seed(123)
df <- diamonds[sample(1:nrow(diamonds), size = 2000),]

df %>%
  plot_ly(x = carat, y = price, mode = "markers",
          color = color, size = price,
          marker = list(size = 5, opacity = 0.7,
                        line = list(color = "grey", width = 1)),
          hovermode = "text",
          text = paste0("x:", carat, "<br>",
                        "y:", price)
          ) %>%

  layout(title = "Diamonds dataset",
         titlefont = list(size = 20, family = "serif"),
         plot_bgcolor = "#a6a6a6",
         paper_bgcolor = "#e6e6e6")
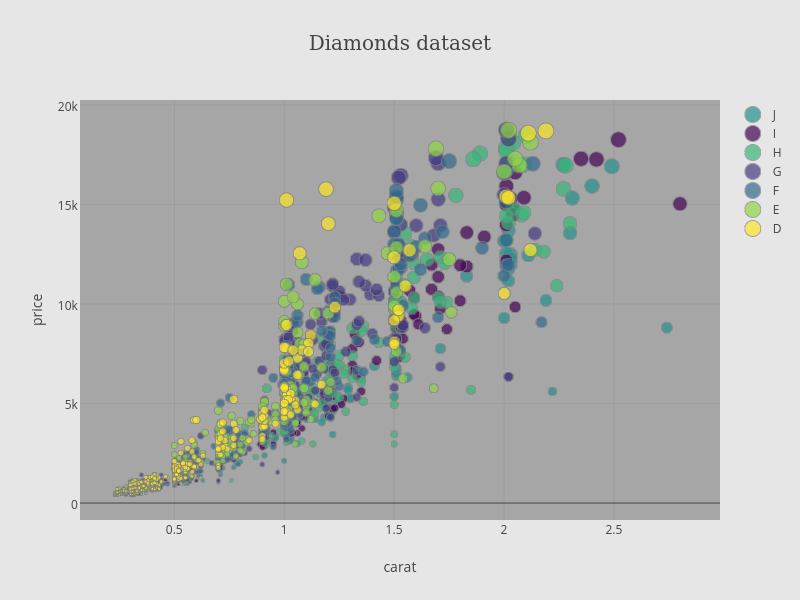
It would be nice to be able to just do this:
library(plotlyvis)
set.seed(123)
df <- diamonds[sample(1:nrow(diamonds), size = 2000),]

with(df,
     scatterplotly(x = carat, y = price,
                   groupcolor = color,
                   groupsize = price,
                   title = "Diamonds Dataset",
                   subtitle = "Diamonds are forever",
                   description = "This is a sample visualization from<br>the plotlyvis package.",
                   theme = "LIGHTGRAY")
)

While this package aims to provide an easy to use interface to plotly, advanced users might consider using the plotly package directly due to its sheer flexibility.
Example use cases
Currently only scatterplots are supported.
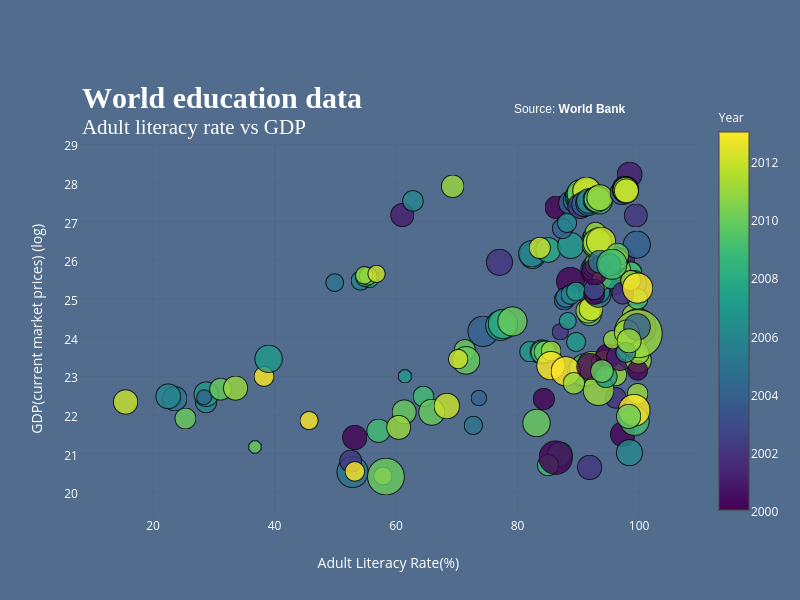
Scatterplot
library(plotlyvis)
data("WorldEducationIndicators")
WorldEducationIndicators <- na.omit(WorldEducationIndicators)

with(WorldEducationIndicators,
     scatterplotly(x = Adult.literacy.rate, y = log(GDP.at.market.prices),
                   groupcolor = Year, groupsize = Government.education.expenditure,
                   title = "World education data",
                   subtitle = "Adult literacy rate vs GDP",
                   description = "Source: <b>World Bank</b>",
                   desc.y = 1,
                   xlab = "Adult Literacy Rate(%)",
                   ylab = "GDP(current market prices) (log)",
                   theme = "BLUE",
                   height = 600,
                   width = 800))
royr2/plotlyvis documentation built on May 27, 2019, 11:47 p.m.
R Package Documentation
Browse R Packages
We want your feedback!
Note that we can't provide technical support on individual packages. You should contact the package authors for that.
plotlyvis
An R package aimed at providing a base plot() like interface to create presentation quality interactive charts in R using Plotly's R API. The package builds on Carson Sievert's plotly package.
I personally like the plot_ly() interface better and more flexible to use. This package aims to provide some standard layouts, color schemes and annotation blocks to help lower the effort needed to build a visually appealing / presentation worthy chart.
Please note that this is very much a work in progress and I hope to build out its functionality in the next few months. This is my very first R-package so any comments / suggestions are very much welcome.
Why another package?
If you are an analyst like me, you are probably juggling a lot of different things at the same time all the while trying to optimize on time.
While it is fun and insightful to write something like this:
library(plotly)
set.seed(123)
df <- diamonds[sample(1:nrow(diamonds), size = 2000),]
df %>%
plot_ly(x = carat, y = price, mode = "markers",
color = color, size = price,
marker = list(size = 5, opacity = 0.7,
line = list(color = "grey", width = 1)),
hovermode = "text",
text = paste0("x:", carat, "<br>",
"y:", price)
) %>%
layout(title = "Diamonds dataset",
titlefont = list(size = 20, family = "serif"),
plot_bgcolor = "#a6a6a6",
paper_bgcolor = "#e6e6e6")
It would be nice to be able to just do this:
library(plotlyvis)
set.seed(123)
df <- diamonds[sample(1:nrow(diamonds), size = 2000),]
with(df,
scatterplotly(x = carat, y = price,
groupcolor = color,
groupsize = price,
title = "Diamonds Dataset",
subtitle = "Diamonds are forever",
description = "This is a sample visualization from<br>the plotlyvis package.",
theme = "LIGHTGRAY")
)
While this package aims to provide an easy to use interface to plotly, advanced users might consider using the plotly package directly due to its sheer flexibility.
Example use cases
Currently only scatterplots are supported.
Scatterplot
library(plotlyvis)
data("WorldEducationIndicators")
WorldEducationIndicators <- na.omit(WorldEducationIndicators)
with(WorldEducationIndicators,
scatterplotly(x = Adult.literacy.rate, y = log(GDP.at.market.prices),
groupcolor = Year, groupsize = Government.education.expenditure,
title = "World education data",
subtitle = "Adult literacy rate vs GDP",
description = "Source: <b>World Bank</b>",
desc.y = 1,
xlab = "Adult Literacy Rate(%)",
ylab = "GDP(current market prices) (log)",
theme = "BLUE",
height = 600,
width = 800))
R Package Documentation
Browse R Packages
We want your feedback!
Note that we can't provide technical support on individual packages. You should contact the package authors for that.
Embedding an R snippet on your website
Add the following code to your website.
For more information on customizing the embed code, read Embedding Snippets.