README.md
In svcuonghvktqs/FORA: A package for time sereis forecast accuracy evaluation
FORA: A package for time sereis forecast accuracy evaluation
The package FORA includes a set of functions to load data, to visualize forecast features and for making significant conclusion
about difference between results obtained by user-defined forecasting models.The comparison performed according build-in error
measures, such as common-used as well as advanced and stable measures.
Install from GitHub:
  install.packages("devtools")
  devtools::install_github("svcuonghvktqs/FORA")
To get help for the package:
  library(FORA)
  help(package = "FORA")
Set of functions:
Function for forecast data visualization:
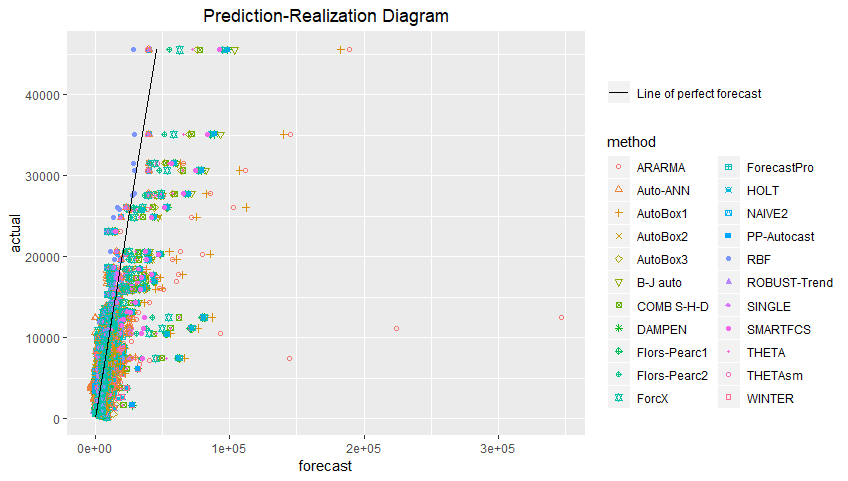
- plotPRD(): Prediction-Realization Diagram
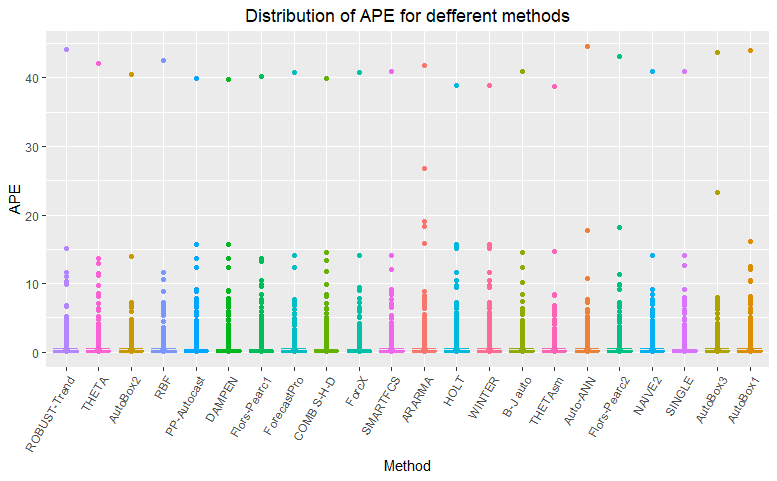
- plotAPEs(): Boxplot of Absolute Percentage errors
- plotPEs(): Boxplot of Percentage errors
Function time sereis forecast accuracy evaluation
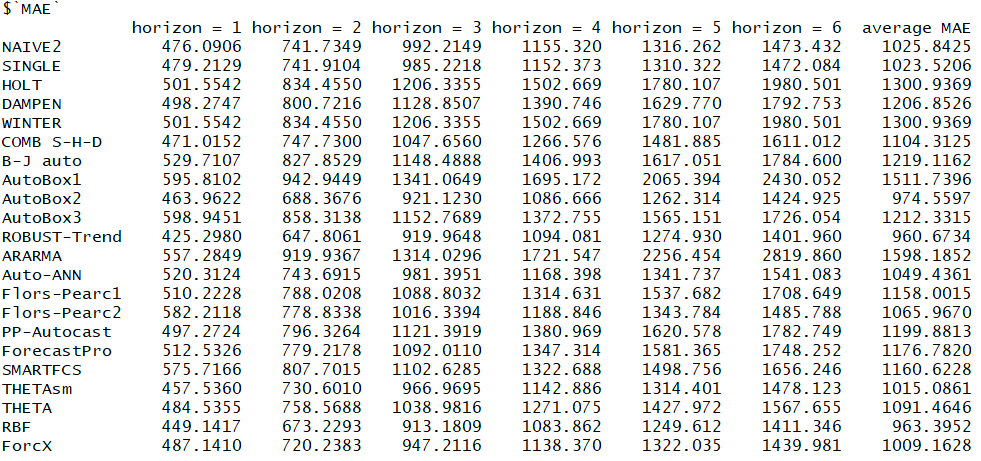
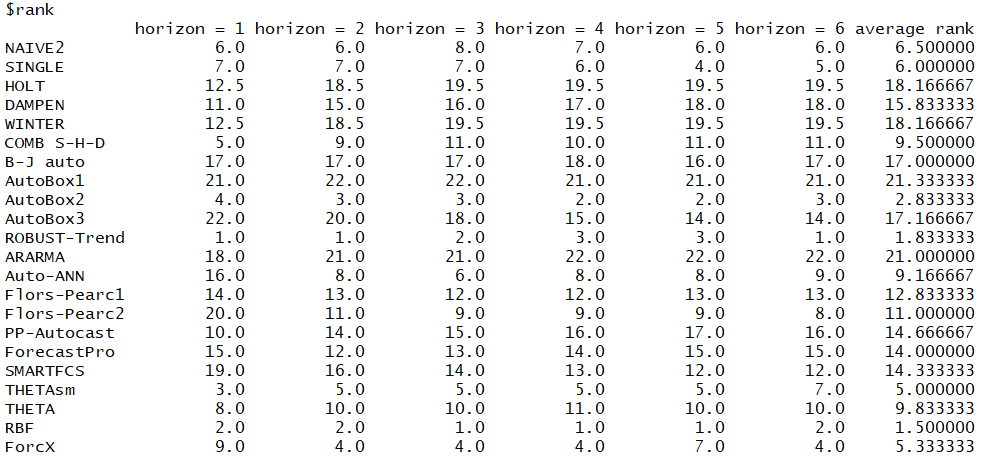
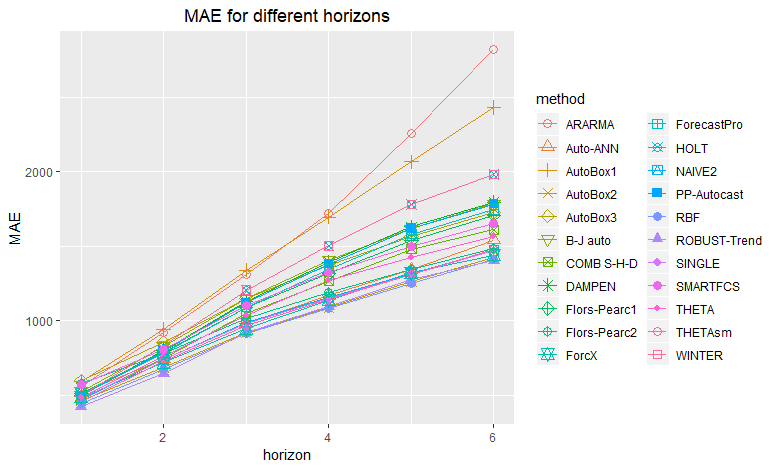
- calculateMAEs(): Mean Absolute errors
- calculateMSEs(): Mean square errors
- calculateRMSEs(): Root Mean square errors
- calculateMAPEs(): Mean Absolute Percentage errors
- calculateMdAPEs(): Median Absolute Percentage errors
- calculateMPEs(): Mean Percentage errors
- calculateGMAPEs(): Geometric Mean Absolute Percentage error
- calculateSMAPEs(): Symmetric Mean Absolute Percentage Errors
- calculateSMdAPEs(): Symmetric Median Absolute Percentage Errors
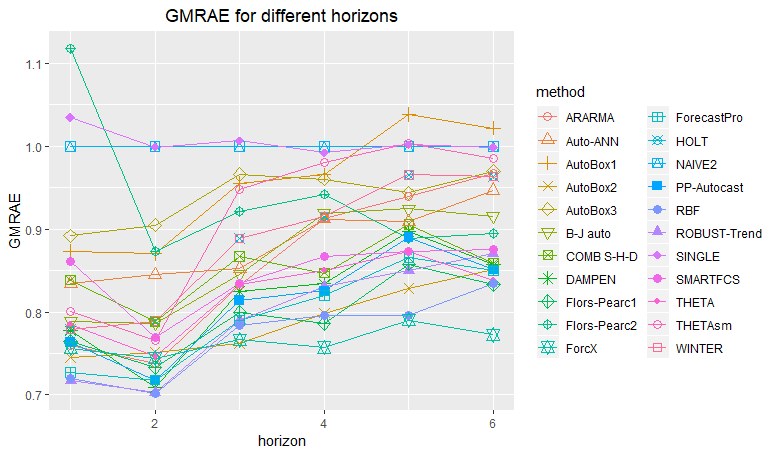
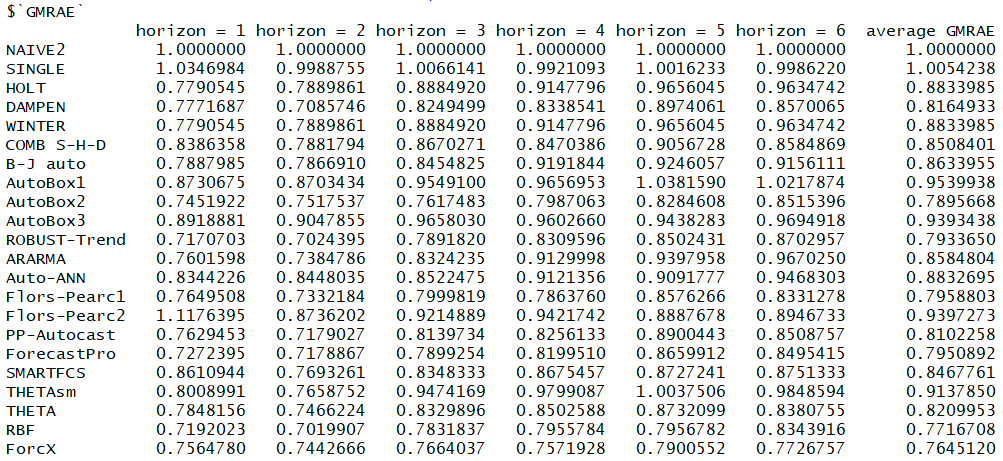
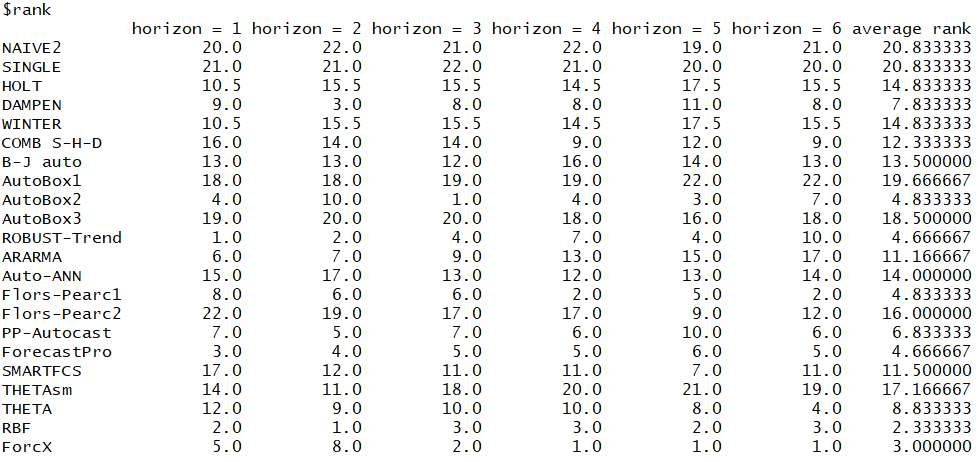
- calculateGMRAEs(): Geometric Mean Relative Absolute Error
- calculateMASEs(): Mean Absolute Scaled Erro
- calculatePB_MAEs(): Precentage Better(MAE)
- calculateMAD_MAEN_ratio():
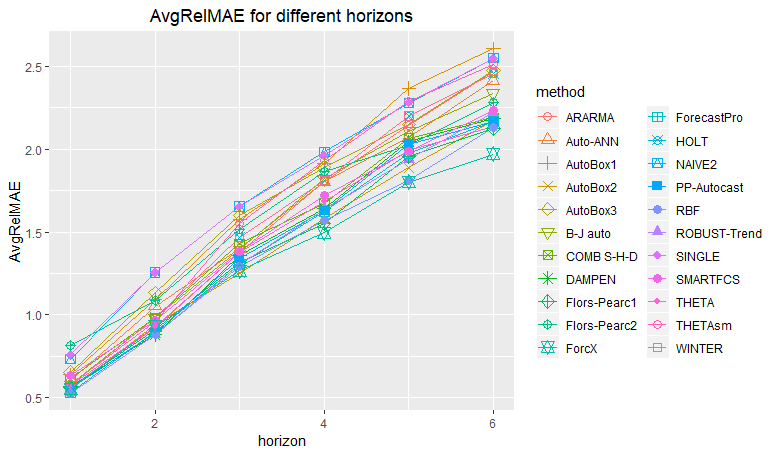
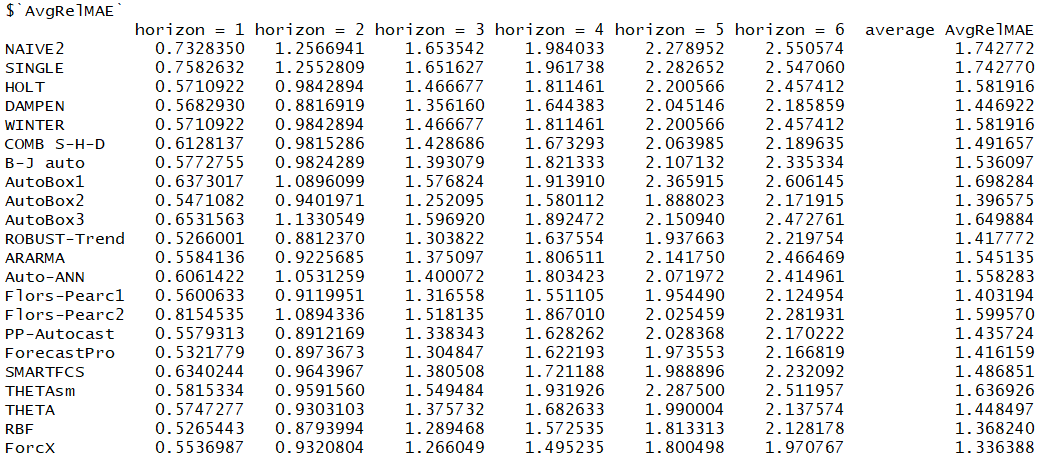
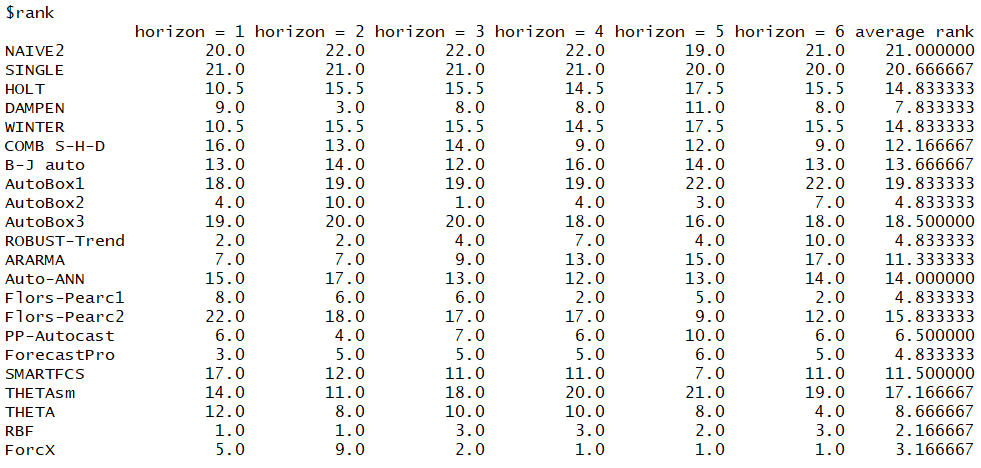
- calculateAvgRelMAEs(): Average Relative Mean Absolute Error
Usage
Prediction-Realization Diagram for the given data from dataset:
# plotPRD(df, useLogs = FALSE, xlim = NULL, ylim = NULL)
# examples:
library(forecast)
plotPRD(df = FORAYearForecast)
Boxplot of Absolute Percentage errors:
# boxplotAPEs(df, useLogs = NULL, notch = FALSE, limits = NULL, showOutliers = NULL)
# example:
boxplotAPEs(FORAYearForecast)
Time sereis forecast accuracy evaluation:
# calculateMAEs(frame, sort = FALSE)
calculateMAEs(frame = FORAYearForecast)
calculateAvgRelMAEs(frame = FORAYearForecast, frame2 = FORAYearSeries)
calculateGMRAEs(frame = FORAYearForecast, benchmark_method = "NAIVE2")
svcuonghvktqs/FORA documentation built on May 20, 2019, 9:57 a.m.
R Package Documentation
Browse R Packages
We want your feedback!
Note that we can't provide technical support on individual packages. You should contact the package authors for that.
FORA: A package for time sereis forecast accuracy evaluation
The package FORA includes a set of functions to load data, to visualize forecast features and for making significant conclusion about difference between results obtained by user-defined forecasting models.The comparison performed according build-in error measures, such as common-used as well as advanced and stable measures.
Install from GitHub:
install.packages("devtools")
devtools::install_github("svcuonghvktqs/FORA")
To get help for the package:
library(FORA)
help(package = "FORA")
Set of functions:
Function for forecast data visualization:
- plotPRD(): Prediction-Realization Diagram
- plotAPEs(): Boxplot of Absolute Percentage errors
- plotPEs(): Boxplot of Percentage errors
Function time sereis forecast accuracy evaluation
- calculateMAEs(): Mean Absolute errors
- calculateMSEs(): Mean square errors
- calculateRMSEs(): Root Mean square errors
- calculateMAPEs(): Mean Absolute Percentage errors
- calculateMdAPEs(): Median Absolute Percentage errors
- calculateMPEs(): Mean Percentage errors
- calculateGMAPEs(): Geometric Mean Absolute Percentage error
- calculateSMAPEs(): Symmetric Mean Absolute Percentage Errors
- calculateSMdAPEs(): Symmetric Median Absolute Percentage Errors
- calculateGMRAEs(): Geometric Mean Relative Absolute Error
- calculateMASEs(): Mean Absolute Scaled Erro
- calculatePB_MAEs(): Precentage Better(MAE)
- calculateMAD_MAEN_ratio():
- calculateAvgRelMAEs(): Average Relative Mean Absolute Error
Usage
Prediction-Realization Diagram for the given data from dataset:
# plotPRD(df, useLogs = FALSE, xlim = NULL, ylim = NULL)
# examples:
library(forecast)
plotPRD(df = FORAYearForecast)
Boxplot of Absolute Percentage errors:
# boxplotAPEs(df, useLogs = NULL, notch = FALSE, limits = NULL, showOutliers = NULL)
# example:
boxplotAPEs(FORAYearForecast)
Time sereis forecast accuracy evaluation:
# calculateMAEs(frame, sort = FALSE)
calculateMAEs(frame = FORAYearForecast)
calculateAvgRelMAEs(frame = FORAYearForecast, frame2 = FORAYearSeries)
calculateGMRAEs(frame = FORAYearForecast, benchmark_method = "NAIVE2")
R Package Documentation
Browse R Packages
We want your feedback!
Note that we can't provide technical support on individual packages. You should contact the package authors for that.
Embedding an R snippet on your website
Add the following code to your website.
For more information on customizing the embed code, read Embedding Snippets.