README.md
In tavoundjian/jerzpals: Jerzy-inspired color palettes
jerzpals
Color palettes for R and ggplot2 inspired by my stylish friend and colleague, Jerzy Eisenberg-Guyot. Jerzy is many things to many people, but he is a paragon of style to just about everyone. This package is a way to bring Jerzy's style to the masses.
This package was a convenient excuse to learn how to build packages in R and host them on Github (and eventually CRAN). And also an opportunity to work with my wife, Tanya Basmadjian Avoundjian, who is a very talented graphic designer (who is always supplying me with awesome color palettes for visualizations!).
Installation
To install, run the following in R:
devtools::install_github("tavoundjian/jerzpals")
Usage
The functions scale_fill_jerzeg and scale_color_jerzeg can be used directly with ggplot2.
Arguments
- alpha: pass through parameter to jerz. Numeric value between 0 and 1 that controls opacity of color map (1 = opaque).
- begin: numeric value between 0 and 1. Indicates the first color in the palette/map.
- end: numeric value between 0 and 1. Indicates the last color in the palette/map.
- direction: sets the order of the colors in the scale. If 1 (default), colors are output by
jerz_pal. If -1, the order of colors is reversed.
- discrete: generate a discrete palette? (default:
FALSE - generate continuous palette)
- option: character string indicating the palette option to use. (see "Palettes" below for available palette options)
Examples
library(jerzpals)

library(ggplot2)
# library(jerzpals)

data(iris)

# Discrete scale
ggplot(data = iris, aes(x = Species, y = Petal.Length)) +
geom_bar(aes(fill = Species), stat = "identity") +
scale_fill_jerzeg(option = "jerzshoe2", discrete = T) +
theme_bw()

# Continuous scale
ggplot(data = iris, aes(x = Petal.Width, y = Petal.Length)) +
geom_point(aes(color = Sepal.Width)) +
scale_color_jerzeg(option = "H", begin = 0, end = 0.5) + # use begin and end to set range of colors used in the palette
theme_bw()
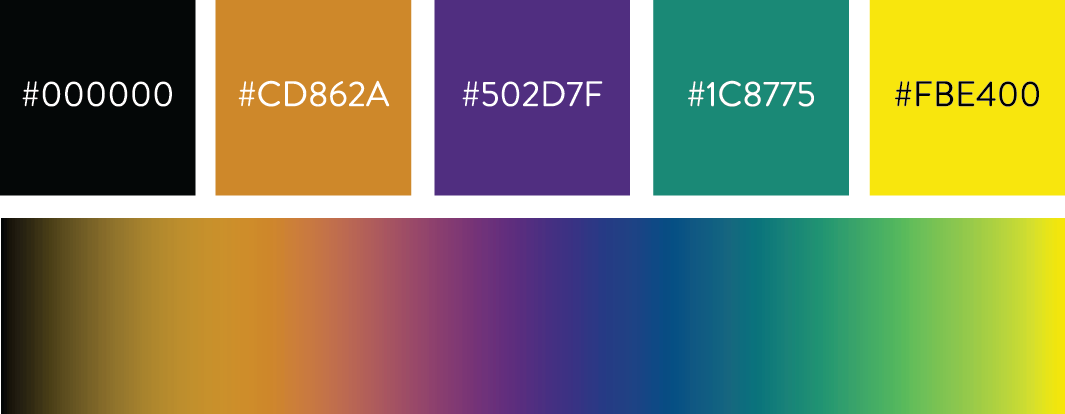
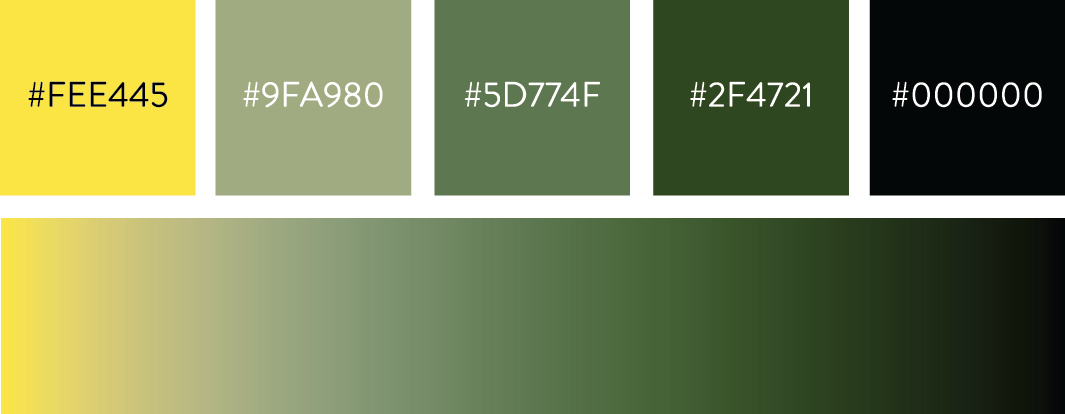
Palettes
jerzshoe1 (option = "A")
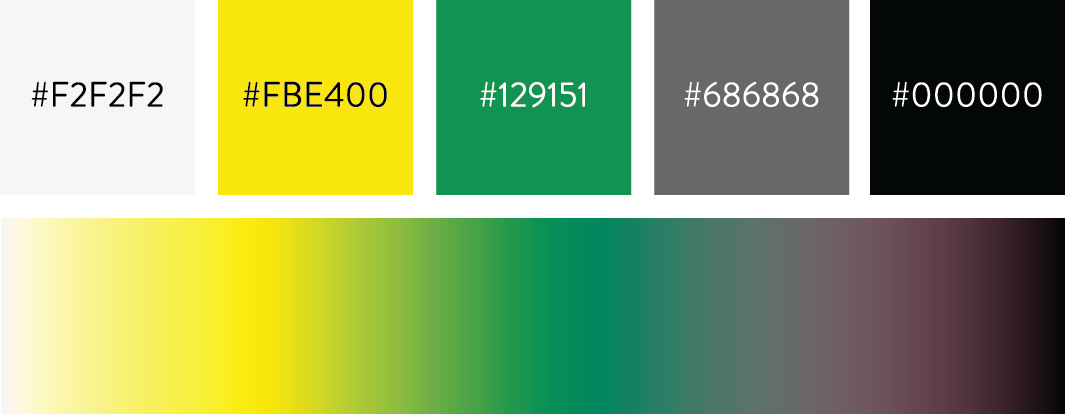
jerzeg (option = "B")
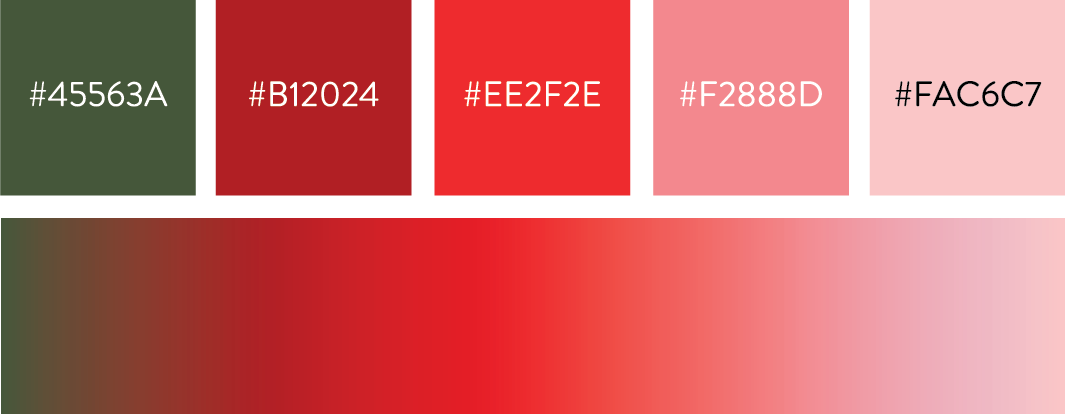
jerzhat (option = "C")
jerzshirt (option = "D")
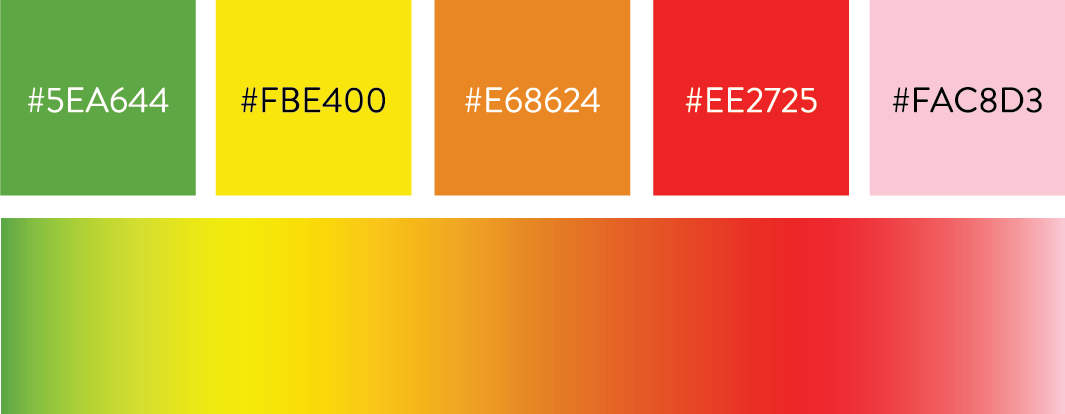
jerzshoe2 (option = "E")
jerzjacket (option = "F")
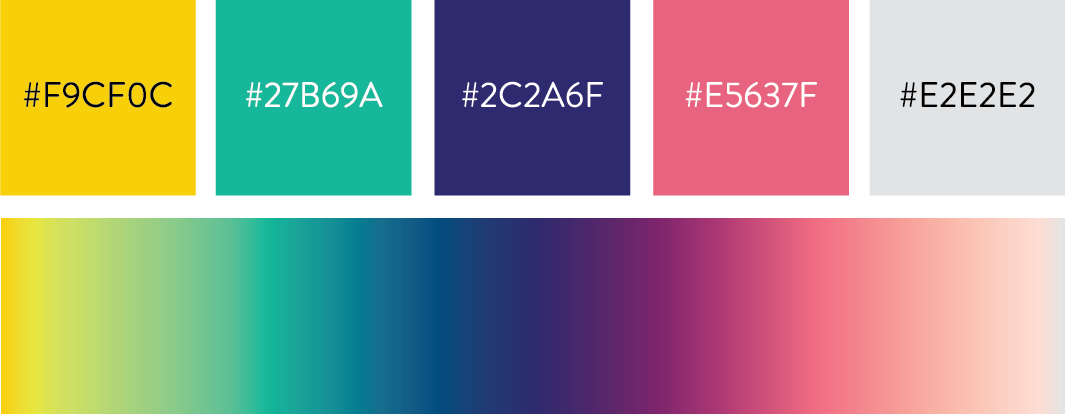
jerzpack1 (option = "G")
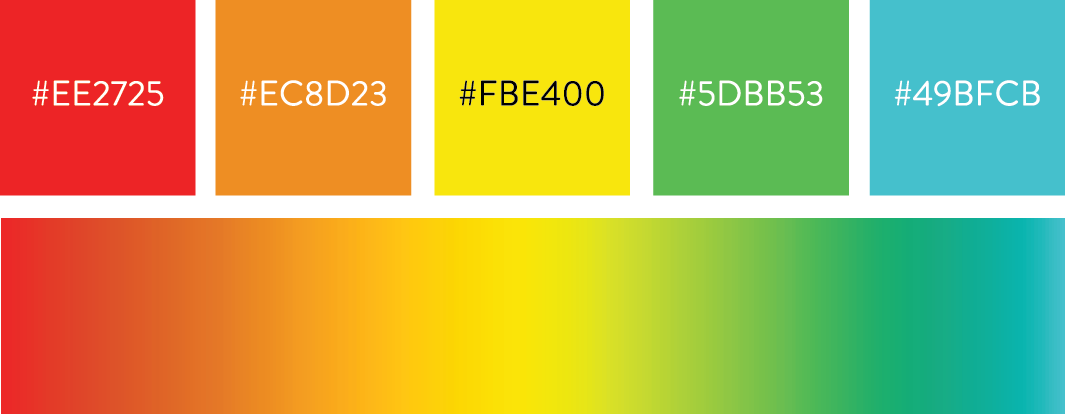
jerzpack2 (option = "H")

tavoundjian/jerzpals documentation built on Oct. 26, 2020, 5:46 a.m.
R Package Documentation
Browse R Packages
We want your feedback!
Note that we can't provide technical support on individual packages. You should contact the package authors for that.
jerzpals
Color palettes for R and ggplot2 inspired by my stylish friend and colleague, Jerzy Eisenberg-Guyot. Jerzy is many things to many people, but he is a paragon of style to just about everyone. This package is a way to bring Jerzy's style to the masses.
This package was a convenient excuse to learn how to build packages in R and host them on Github (and eventually CRAN). And also an opportunity to work with my wife, Tanya Basmadjian Avoundjian, who is a very talented graphic designer (who is always supplying me with awesome color palettes for visualizations!).
Installation
To install, run the following in R:
devtools::install_github("tavoundjian/jerzpals")
Usage
The functions scale_fill_jerzeg and scale_color_jerzeg can be used directly with ggplot2.
Arguments
- alpha: pass through parameter to jerz. Numeric value between 0 and 1 that controls opacity of color map (1 = opaque).
- begin: numeric value between 0 and 1. Indicates the first color in the palette/map.
- end: numeric value between 0 and 1. Indicates the last color in the palette/map.
- direction: sets the order of the colors in the scale. If 1 (default), colors are output by
jerz_pal. If -1, the order of colors is reversed. - discrete: generate a discrete palette? (default:
FALSE- generate continuous palette) - option: character string indicating the palette option to use. (see "Palettes" below for available palette options)
Examples
library(jerzpals)
library(ggplot2)
# library(jerzpals)
data(iris)
# Discrete scale
ggplot(data = iris, aes(x = Species, y = Petal.Length)) +
geom_bar(aes(fill = Species), stat = "identity") +
scale_fill_jerzeg(option = "jerzshoe2", discrete = T) +
theme_bw()
# Continuous scale
ggplot(data = iris, aes(x = Petal.Width, y = Petal.Length)) +
geom_point(aes(color = Sepal.Width)) +
scale_color_jerzeg(option = "H", begin = 0, end = 0.5) + # use begin and end to set range of colors used in the palette
theme_bw()
Palettes
jerzshoe1 (option = "A")
jerzeg (option = "B")
jerzhat (option = "C")
jerzshirt (option = "D")
jerzshoe2 (option = "E")
jerzjacket (option = "F")
jerzpack1 (option = "G")
jerzpack2 (option = "H")
R Package Documentation
Browse R Packages
We want your feedback!
Note that we can't provide technical support on individual packages. You should contact the package authors for that.
Embedding an R snippet on your website
Add the following code to your website.
For more information on customizing the embed code, read Embedding Snippets.