paper.md
In tgve/tgver: Turing Geovisualization Engine R package
title: 'Turing Geovisualization Engine R package'
tags:
- geovisualization
- visualization
- spatiotemporal data
authors:
- name: L Hama
orcid: 0000-0003-1912-4890
affiliations: 1
- name: R Beecham
orcid: 0000-0001-8563-7251
affiliations: 2
- name: N Lomax
orcid: 0000-0001-9504-7570
affiliations: 2
affiliations:
- name: Leeds Institute for Data Analytics (LIDA), University of Leeds
index: 1
- name: School of Geography and Leeds Institute for Data Analytics (LIDA), University of Leeds
index: 2
date: 18 March 2022
bibliography: paper.bib
Summary
The Turing Geovisualisation Engine (TGVE) is an open source, web-based, interactive visual analytics tool for geospatial data analysis, built using R and React. The R package tgver is developed to be used with the TGVE front end npm package tgvejs. The R package which has just been published on CRAN (The Comprehensive R Archive Network) aims to facilitate interactive geospatial analysis and visualization in R, use R’s ecosystem to drive advanced geospatial data processing, and facilitate deployment of geospatial web applications in production. A design principle in the TGVE is to bring the reproducibility of data science workflows to Graphic User Interfaces (GUI). The approach is to use web standards to allow R users to use the TGVE's API (Application Programming Interface) to generate visualizations that can be reproduced.
Statement of need
The package is needed because data scientists and researchers who want to rapidly perform spatiotemporal querying of a data set would need to learn various concepts and R packages that might operate very differently to their usual data analysis and processing workflows. Using the tgver package they still need to learn how the TGVE works, but in a typical scenario when a data scientist has a .geojson geography data file and a csv data file and want to generate geospatial visualizations, they can bypass some of the workflows required. The TGVE front-end npm package can process these two files, search for a matching column between them and generate visualizations based on the data in either or both of the data sources. If the .geojson or the csv file contains the geography, in the case of the csv latitude and longitude columns, the TGVE can process it as well. Users can also do this either in Rmarkdown notebooks or indeed in Jupyter notebooks. This is one of the main features of the TGVE and has been driven by the work in the tgver R package. If the data sources are hosted remotely and are available for processing, the TGVE can take the URLs (Unified Resource Locator) as URL parameters.
For example let us demonstrate how we can use the TGVE to combine a .geojson file which contains some geography (boundaries) and a .cvs file that contains some data about those geographies with a matching column name. Also, we would want to embed the outcome in an Rmarkdown (or a Jupyter notebook). This can be done depending on where the data sources are and whether we use the R package. An instance of the TGVE front-end is available at: https://tgve.github.io/app/. We can construct a URL as follows and see a .geojson file and a .csv file being pulled and processed by the TGVE front-end using some of the API variables like defaultURL, geographyURL etc.:
# using knitr R package
knitr::include_url(
   paste0(
   "https://tgve.github.io/app/?",
   "defaultURL=https://raw.githubusercontent.com/tgve/example-data/main/schools/data.csv&",
   "geographyURL=https://raw.githubusercontent.com/saferactive/tgve/main/las-only-code.geojson&",
   "geographyColumn=la_code&",
   "column=ranking_count"))
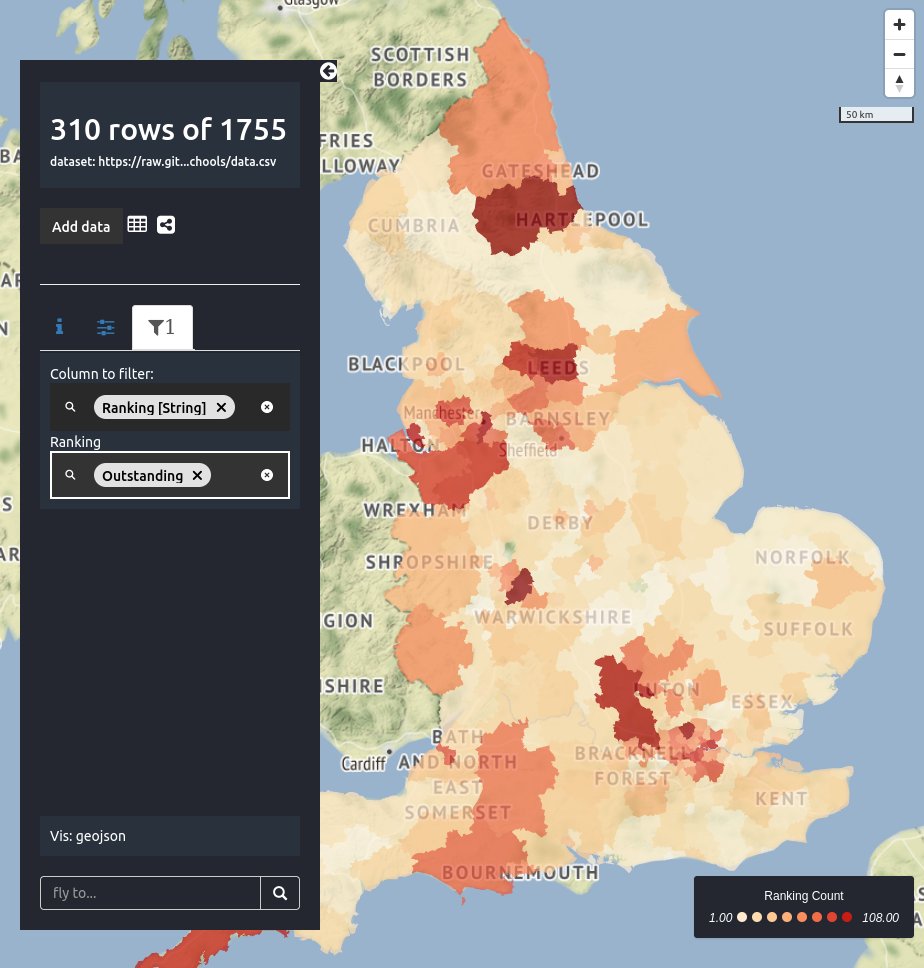 Figure 1: A screenshot from the above URL rendered on Firefox v97.0 on an Ubuntu 20.04. The figure shows school rankings [@edubase] from the
 csv data source using the .geojson geography file (UK's Local Authority District boundaries). The data has been subset further with (using TGVE's filtering user interface) rankings showing "Outstanding" school rankings only.
A screenshot of the above URL is shown in Figure 1 and the knitr::include_url function can be used in Rmarkdowns if the output of the document is set to output: html_document. The tgver package enables interactive R based workflow of the same scenario using geospatial R packages and objects. For instance if we are working with local data set, such as an sf[@pebesma2018sf] object, then a TGVE based workflow would be like the following using the tgver R package:
require(weathercan)
require(sf)
require(geojsonsf)
# get some weather stations
w = w = weathercan::stations()[1:1000,]
# clean up the data
w = w[!is.null(w$lat) & !is.null(w$lon), ]
# turn the points into an sf object
w.sf = st_as_sf(w, coords = c("lon", "lat"))
# explore it in TGVE
tgver::explore_sf(w.sf)
#> Serving data from http://127.0.0.1:8000/explore_sf
#> Browsing http://127.0.0.1:8000?defaultURL=http://127.0.0.1:8000/explore_sf
#> Running plumber API at http://127.0.0.1:8000
Finally, the tgver takes a different approach of bringing JavaScript (JS) applications into R but specifically bringing modern libraries like React into R. Some R packages (such as Shiny [@beeley2013web]) rely on a coupled method of using R and JS. There are other mapping packages which drive JS from R. The tgver uses a production built output from a React application and relies on RESTful [@restful] client-server communication using the plumber [@plumber] R package.
Acknowledgement
This work was supported by Towards Turing 2.0 under the EPSRC Grant EP/W037211/1 & The Alan Turing Institute.
References
tgve/tgver documentation built on March 11, 2023, 10:13 p.m.
R Package Documentation
Browse R Packages
We want your feedback!
Note that we can't provide technical support on individual packages. You should contact the package authors for that.
title: 'Turing Geovisualization Engine R package' tags: - geovisualization - visualization - spatiotemporal data authors: - name: L Hama orcid: 0000-0003-1912-4890 affiliations: 1 - name: R Beecham orcid: 0000-0001-8563-7251 affiliations: 2 - name: N Lomax orcid: 0000-0001-9504-7570 affiliations: 2 affiliations: - name: Leeds Institute for Data Analytics (LIDA), University of Leeds index: 1 - name: School of Geography and Leeds Institute for Data Analytics (LIDA), University of Leeds index: 2 date: 18 March 2022 bibliography: paper.bib
Summary
The Turing Geovisualisation Engine (TGVE) is an open source, web-based, interactive visual analytics tool for geospatial data analysis, built using R and React. The R package tgver is developed to be used with the TGVE front end npm package tgvejs. The R package which has just been published on CRAN (The Comprehensive R Archive Network) aims to facilitate interactive geospatial analysis and visualization in R, use R’s ecosystem to drive advanced geospatial data processing, and facilitate deployment of geospatial web applications in production. A design principle in the TGVE is to bring the reproducibility of data science workflows to Graphic User Interfaces (GUI). The approach is to use web standards to allow R users to use the TGVE's API (Application Programming Interface) to generate visualizations that can be reproduced.
Statement of need
The package is needed because data scientists and researchers who want to rapidly perform spatiotemporal querying of a data set would need to learn various concepts and R packages that might operate very differently to their usual data analysis and processing workflows. Using the tgver package they still need to learn how the TGVE works, but in a typical scenario when a data scientist has a .geojson geography data file and a csv data file and want to generate geospatial visualizations, they can bypass some of the workflows required. The TGVE front-end npm package can process these two files, search for a matching column between them and generate visualizations based on the data in either or both of the data sources. If the .geojson or the csv file contains the geography, in the case of the csv latitude and longitude columns, the TGVE can process it as well. Users can also do this either in Rmarkdown notebooks or indeed in Jupyter notebooks. This is one of the main features of the TGVE and has been driven by the work in the tgver R package. If the data sources are hosted remotely and are available for processing, the TGVE can take the URLs (Unified Resource Locator) as URL parameters.
For example let us demonstrate how we can use the TGVE to combine a .geojson file which contains some geography (boundaries) and a .cvs file that contains some data about those geographies with a matching column name. Also, we would want to embed the outcome in an Rmarkdown (or a Jupyter notebook). This can be done depending on where the data sources are and whether we use the R package. An instance of the TGVE front-end is available at: https://tgve.github.io/app/. We can construct a URL as follows and see a .geojson file and a .csv file being pulled and processed by the TGVE front-end using some of the API variables like defaultURL, geographyURL etc.:
# using knitr R package
knitr::include_url(
paste0(
"https://tgve.github.io/app/?",
"defaultURL=https://raw.githubusercontent.com/tgve/example-data/main/schools/data.csv&",
"geographyURL=https://raw.githubusercontent.com/saferactive/tgve/main/las-only-code.geojson&",
"geographyColumn=la_code&",
"column=ranking_count"))
csv data source using the .geojson geography file (UK's Local Authority District boundaries). The data has been subset further with (using TGVE's filtering user interface) rankings showing "Outstanding" school rankings only.
A screenshot of the above URL is shown in Figure 1 and the knitr::include_url function can be used in Rmarkdowns if the output of the document is set to output: html_document. The tgver package enables interactive R based workflow of the same scenario using geospatial R packages and objects. For instance if we are working with local data set, such as an sf[@pebesma2018sf] object, then a TGVE based workflow would be like the following using the tgver R package:
require(weathercan)
require(sf)
require(geojsonsf)
# get some weather stations
w = w = weathercan::stations()[1:1000,]
# clean up the data
w = w[!is.null(w$lat) & !is.null(w$lon), ]
# turn the points into an sf object
w.sf = st_as_sf(w, coords = c("lon", "lat"))
# explore it in TGVE
tgver::explore_sf(w.sf)
#> Serving data from http://127.0.0.1:8000/explore_sf
#> Browsing http://127.0.0.1:8000?defaultURL=http://127.0.0.1:8000/explore_sf
#> Running plumber API at http://127.0.0.1:8000
Finally, the tgver takes a different approach of bringing JavaScript (JS) applications into R but specifically bringing modern libraries like React into R. Some R packages (such as Shiny [@beeley2013web]) rely on a coupled method of using R and JS. There are other mapping packages which drive JS from R. The tgver uses a production built output from a React application and relies on RESTful [@restful] client-server communication using the plumber [@plumber] R package.
Acknowledgement
This work was supported by Towards Turing 2.0 under the EPSRC Grant EP/W037211/1 & The Alan Turing Institute.
References
R Package Documentation
Browse R Packages
We want your feedback!
Note that we can't provide technical support on individual packages. You should contact the package authors for that.
Embedding an R snippet on your website
Add the following code to your website.
For more information on customizing the embed code, read Embedding Snippets.