In ukgovdatascience/govstyle: A ggplot2 theme in a gov.uk inspired style


govstyle
A package for applying a gov.uk style to plots created in the R package ggplot2.
This package is in an early stage of development; the intended end point is that it should be fully compliant with the gov.uk style guide.
This package turns plots from this:

to this:
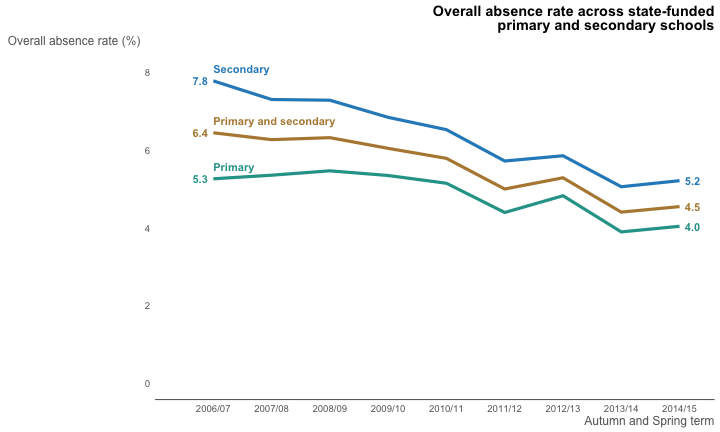
The best source of docmentation is the vignettes.
Installation
To install, the package devtools is required, and can be installed with install.packages('devtools').
govstyle can then be installed using devtools::install_github('ukgovdatascience/govstyle').
Some users may not be able to use the devtools::install_github() commands as a result of network security settings.
If this is the case, govstyle can be installed by downloading the zip of the repository and installing the package locally using devtools::install_local(<path to zip file>).
Installing older versions
The package was revamped somewhat in January 2019. If this breaks your existing
code, try installling the original version with the following code.
devtools::install_github("ukgovdatascience/govstyle", ref = "5d09353b14ccafda4e9c8676993fabf44fcfe5c1")
Functions
theme_gov(): Theme to be applied to plots produced in ggplot2 to give a government statistics publication feel.gov_cols: A vector of the gov.uk extended palette.check_pal(): Display the extended gov.uk palette in a pie chart.
Examples
See Vignette for in depth usage examples.
theme_gov
knitr::opts_chunk$set(
  warning = FALSE,
  message = FALSE,
  error = FALSE
  )
library(ggplot2)
library(dplyr)
#devtools::install_github("ukgovdatascience/govstyle")
library(govstyle)
p <- mtcars %>%
  ggplot +
  aes(
    x = wt,
    y = mpg,
    col = factor(cyl)
    ) +
  geom_point()

p

p +
  theme_gov()
check_pal
## Show gov.uk colours

check_pal()

## Show a subset of gov.uk colours

## Choose n colours:

check_pal(2)

check_pal(3)

check_pal(4)

## Pick a range of colours

check_pal(3:8)

check_pal(c(1,10))

## Pick colours manually

check_pal(
  x = gov_cols[c("green", "grass_green")]
  )
ukgovdatascience/govstyle documentation built on Oct. 8, 2019, 7:39 p.m.
R Package Documentation
Browse R Packages
We want your feedback!
Note that we can't provide technical support on individual packages. You should contact the package authors for that.
govstyle
A package for applying a gov.uk style to plots created in the R package ggplot2. This package is in an early stage of development; the intended end point is that it should be fully compliant with the gov.uk style guide.
This package turns plots from this:
to this:
The best source of docmentation is the vignettes.
Installation
To install, the package devtools is required, and can be installed with install.packages('devtools').
govstyle can then be installed using devtools::install_github('ukgovdatascience/govstyle').
Some users may not be able to use the devtools::install_github() commands as a result of network security settings.
If this is the case, govstyle can be installed by downloading the zip of the repository and installing the package locally using devtools::install_local(<path to zip file>).
Installing older versions
The package was revamped somewhat in January 2019. If this breaks your existing code, try installling the original version with the following code.
devtools::install_github("ukgovdatascience/govstyle", ref = "5d09353b14ccafda4e9c8676993fabf44fcfe5c1")
Functions
theme_gov(): Theme to be applied to plots produced in ggplot2 to give a government statistics publication feel.gov_cols: A vector of the gov.uk extended palette.check_pal(): Display the extended gov.uk palette in a pie chart.
Examples
See Vignette for in depth usage examples.
theme_gov
knitr::opts_chunk$set( warning = FALSE, message = FALSE, error = FALSE )
library(ggplot2) library(dplyr) #devtools::install_github("ukgovdatascience/govstyle") library(govstyle)
p <- mtcars %>% ggplot + aes( x = wt, y = mpg, col = factor(cyl) ) + geom_point() p p + theme_gov()
check_pal
## Show gov.uk colours check_pal() ## Show a subset of gov.uk colours ## Choose n colours: check_pal(2) check_pal(3) check_pal(4) ## Pick a range of colours check_pal(3:8) check_pal(c(1,10)) ## Pick colours manually check_pal( x = gov_cols[c("green", "grass_green")] )
R Package Documentation
Browse R Packages
We want your feedback!
Note that we can't provide technical support on individual packages. You should contact the package authors for that.
Embedding an R snippet on your website
Add the following code to your website.
For more information on customizing the embed code, read Embedding Snippets.