README.md
In walshc/voronoi: voronoi
voronoi
An R package to output a SpatialPolygonsDataFrame (a shapefile) of the voronoi diagram of given points, bounded by a surrounding shapefile. This is useful, for example, if you only have the centroids of various areas and not the corresponding shapefile. The voronoi diagram can serve as an approximation.
Installation
if (!require(devtools)) install.packages("devtools")
devtools::install_github("walshc/voronoi")
Example Usage
Suppose we only have the centroids of each of the contiguous US states and want to use the voronoi diagram as an approximation.
Download, extract and load a shapefile of US states:
file <- "http://www2.census.gov/geo/tiger/GENZ2015/shp/cb_2015_us_state_20m.zip"
download.file(file, "states.zip")
unzip("states.zip")
shp <- rgdal::readOGR(".", "cb_2015_us_state_20m")
shp <- shp[!(shp@data$STATEFP %in% c("02", "15", "72")),]  # Contiguous US
shp <- sp::spTransform(shp, CRS("+init=epsg:26978"))
Get the centroids of the states as our points:
crds <- sp::coordinates(shp)
To use the function, give it the longitudes, latitudes and the bounding shapefile:
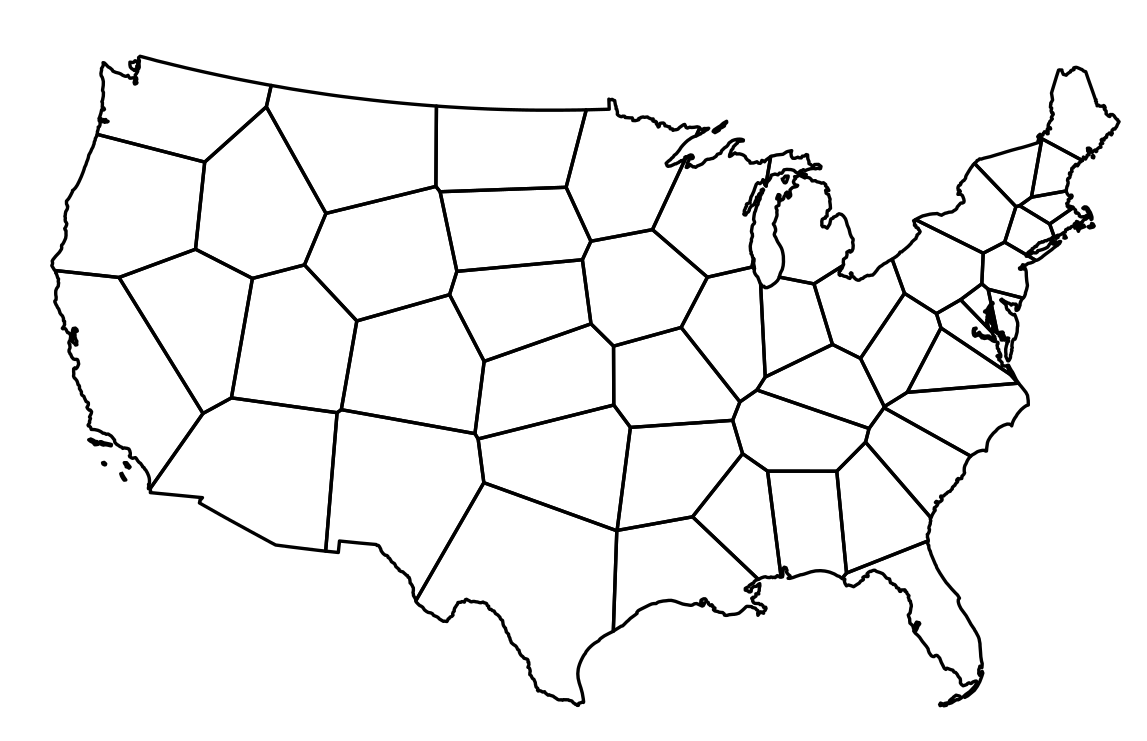
voronoi <- voronoiShapefile(lon = crds[, 1], lat = crds[, 2], shp = shp)
The resulting shapefile looks like this:
You can export as a shapefile for use in other software as follows:
rgdal::writeOGR(voronoi, dsn = ".", driver = "ESRI Shapefile",
                layer = "voronoi-states", overwrite_layer = TRUE)
walshc/voronoi documentation built on May 17, 2019, 8:46 p.m.
R Package Documentation
Browse R Packages
We want your feedback!
Note that we can't provide technical support on individual packages. You should contact the package authors for that.
voronoi
An R package to output a SpatialPolygonsDataFrame (a shapefile) of the voronoi diagram of given points, bounded by a surrounding shapefile. This is useful, for example, if you only have the centroids of various areas and not the corresponding shapefile. The voronoi diagram can serve as an approximation.
Installation
if (!require(devtools)) install.packages("devtools")
devtools::install_github("walshc/voronoi")
Example Usage
Suppose we only have the centroids of each of the contiguous US states and want to use the voronoi diagram as an approximation.
Download, extract and load a shapefile of US states:
file <- "http://www2.census.gov/geo/tiger/GENZ2015/shp/cb_2015_us_state_20m.zip"
download.file(file, "states.zip")
unzip("states.zip")
shp <- rgdal::readOGR(".", "cb_2015_us_state_20m")
shp <- shp[!(shp@data$STATEFP %in% c("02", "15", "72")),] # Contiguous US
shp <- sp::spTransform(shp, CRS("+init=epsg:26978"))
Get the centroids of the states as our points:
crds <- sp::coordinates(shp)
To use the function, give it the longitudes, latitudes and the bounding shapefile:
voronoi <- voronoiShapefile(lon = crds[, 1], lat = crds[, 2], shp = shp)
The resulting shapefile looks like this:
You can export as a shapefile for use in other software as follows:
rgdal::writeOGR(voronoi, dsn = ".", driver = "ESRI Shapefile",
layer = "voronoi-states", overwrite_layer = TRUE)
R Package Documentation
Browse R Packages
We want your feedback!
Note that we can't provide technical support on individual packages. You should contact the package authors for that.
Embedding an R snippet on your website
Add the following code to your website.
For more information on customizing the embed code, read Embedding Snippets.