README.md
In walternewzoo/guillotine: Create and visualize cutoff tables easily.
Guillotine for R
Guillotine is an R package that lets you easily create tables and plots of the percentage of observatations in a vector, that are above / below a moving cutoff point.
This can be used for tuning classifiers in ML.
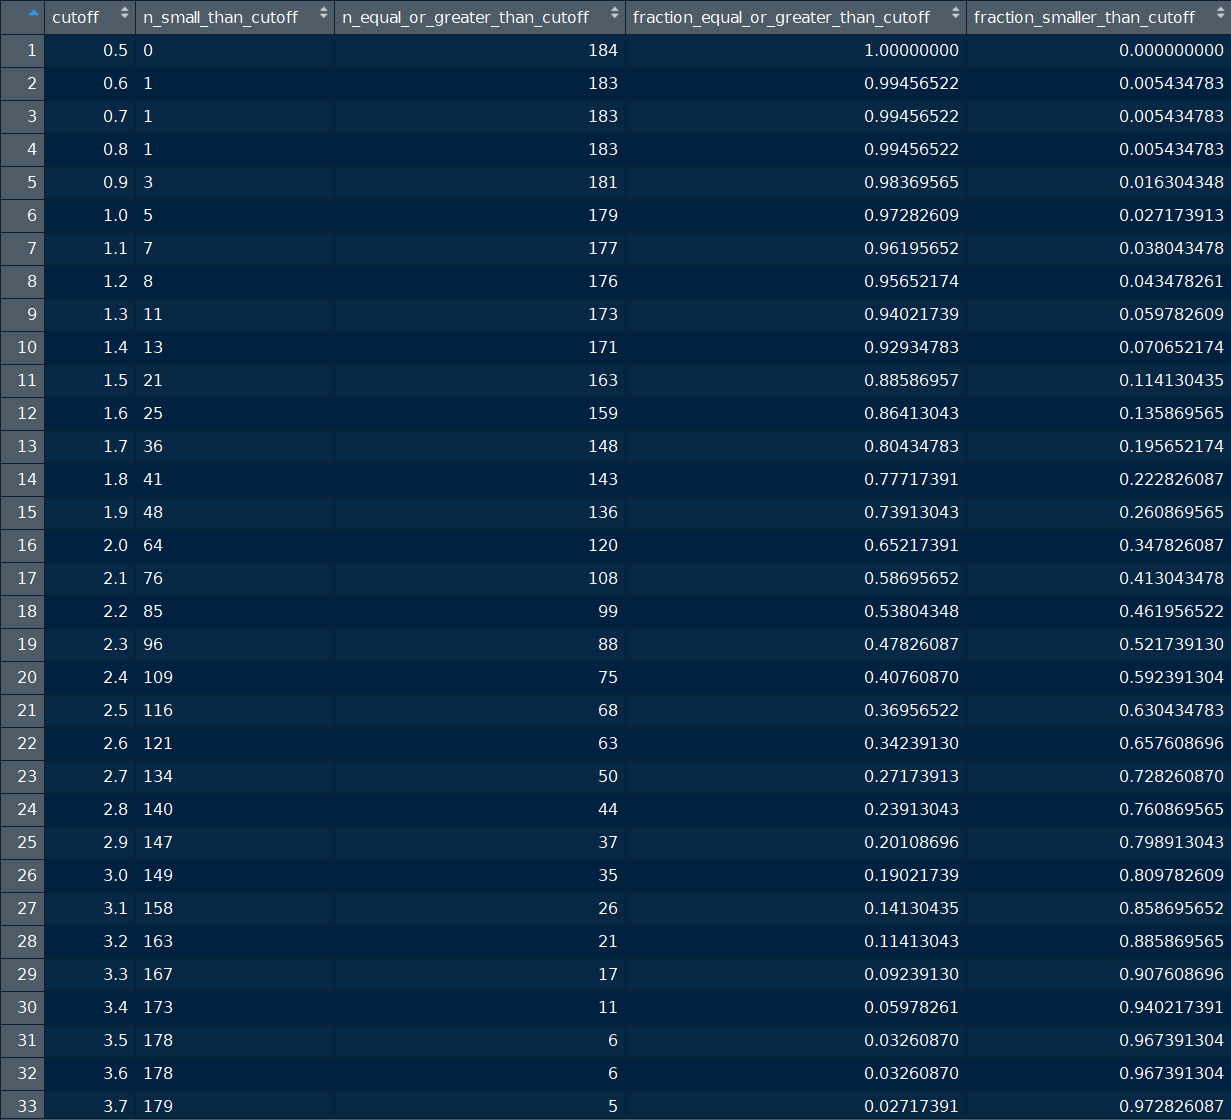
Example output for the table generator function:
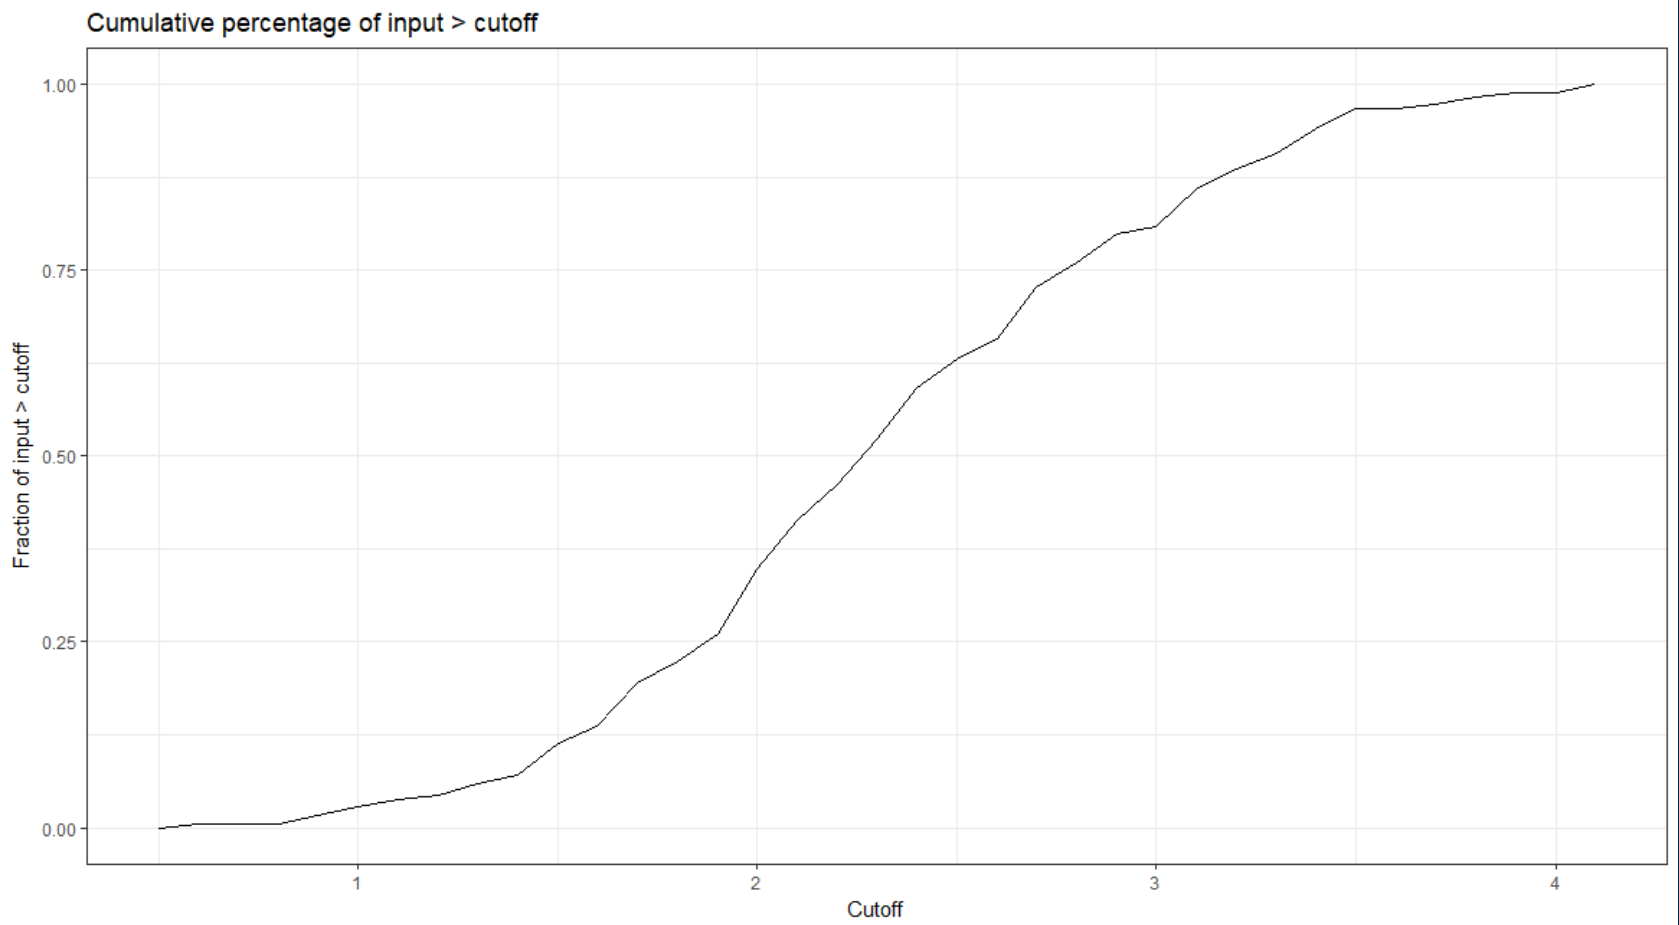
Example output for the plotting function:
For your convenience, here's the installation command.
devtools::install_github("walternewzoo/guillotine")
walternewzoo/guillotine documentation built on May 6, 2019, 12:26 p.m.
R Package Documentation
Browse R Packages
We want your feedback!
Note that we can't provide technical support on individual packages. You should contact the package authors for that.
Guillotine for R
Guillotine is an R package that lets you easily create tables and plots of the percentage of observatations in a vector, that are above / below a moving cutoff point. This can be used for tuning classifiers in ML.
Example output for the table generator function:
Example output for the plotting function:
For your convenience, here's the installation command.
devtools::install_github("walternewzoo/guillotine")
R Package Documentation
Browse R Packages
We want your feedback!
Note that we can't provide technical support on individual packages. You should contact the package authors for that.
Embedding an R snippet on your website
Add the following code to your website.
For more information on customizing the embed code, read Embedding Snippets.