In wardfont/edcpR: Ecological Data Collection and Processing Package
knitr::opts_chunk$set(echo = FALSE)
library(DiagrammeR)
library(knitr)
library(kableExtra)
rm("varechem_s2")
Feedback assignment 1 (1)
- don't include
install.packages(), do include library().
- Give the objects we ask you to create exactly the same name as in the assignment.
- R is Capital-sensitive
- Don't forget to save the result as an object.
Know what to look for
Data type =
elements
- Character
- Numeric
- Integer
- Logical
Data structure =
how elements are ordered
- Factor
- Vector
- Matrix
- List
- Data frame
# Session 2: Data exploration {data-background=https://i.imgflip.com/105j5q.jpg data-background-size=cover}
## Get to know the data (1)
What kind of data did we get?
- What structure has the object?
- What data types are contained within the object?
- Do the structure and data types make sense?
- Are there NA-values or incorrect values?
Any fishy business?

## Plotting ...
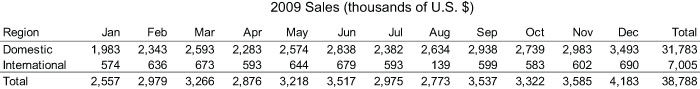{#id .class width=1000}
## ... can be very useful.
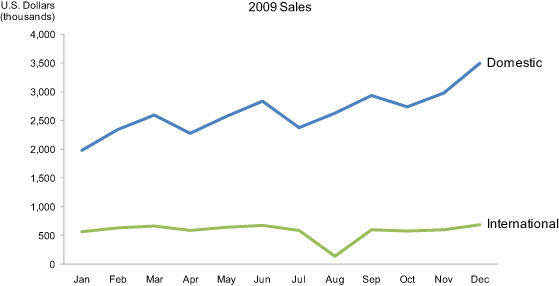{#id .class width=900}
## Get to know the data (2)
What is the quality of the data? How should we interpret it?
Statistical tests:
- Normality?
- Outliers?
- ...
Apply necessary transformation if needed!
## Before we start
If you have difficulties with any aspects of working with R, don't hesitate to say so!
{#id .class height=300 width=500}
## Exercises for today
- Check the structure of the data
- Check NA and incorrect values
- Visualize your data
- Perform outlier analysis
- Check distribution of variables
- Apply transformations to normalize variables
- Apply transformations to linearize relationships
## Update your package
Update your "edcpR" pacakge using the script provided on Toledo `update-edcpR.R`
Find useful tips and function suggestions on the cheat-sheet vignette
wzxhzdk:1
## Exercises: part 1 (30 min)
Use the "varechem_s2" datast in the course package.
- Check the structure and data type of the data (and change in R if necessary)
- **Extra**: Try to assign meaningful levels for the variable *Managementtype*
- Check NA and incorrect values (and change in R if necessary)
- **TIP**: anyNA(), complete.cases(), ...
- Calculate summary metrics (min, max, mean, ...) to check for anomalies
- Visualize your data
- Try different types of graphs (scatterplot, histogram, boxplot...)
## Check structure of data (1)
wzxhzdk:2
## Check structure of data (2)
wzxhzdk:3
## Check structure of data (3)
wzxhzdk:4
## Check structure of data (4)
wzxhzdk:5
## Check structure of data (5)
wzxhzdk:6
## NA and incorrect values (1)
wzxhzdk:7
## NA and incorrect values (2)
wzxhzdk:8
## NA and incorrect values (3)
wzxhzdk:9
wzxhzdk:10
## NA and incorrect values (4)
wzxhzdk:11
## NA and incorrect values (5)
wzxhzdk:12
## NA and incorrect values (6)
wzxhzdk:13
## NA and incorrect values (7)
wzxhzdk:14
## NA and incorrect values (8)
wzxhzdk:15
## Visualize your data (1)
wzxhzdk:16
## Visualize your data (2)
wzxhzdk:17
## Visualize your data (3)
wzxhzdk:18
## Visualize your data (4)
wzxhzdk:19
## Exercises: part 2 (25 min)
- Perform outlier analysis
- for a univariate case: let's consider S
- for a multivariate case: let's consider P~K here
- do we have influential outliers?
- **TIP**: olsrr-package
## Perform outlier analysis (1)
wzxhzdk:20
## Perform outlier analysis (2)
wzxhzdk:21
## Perform outlier analysis (3)
wzxhzdk:22
## Perform outlier analysis (4)
wzxhzdk:23
## Perform outlier analysis (5)
wzxhzdk:24
## Perform outlier analysis (6)
wzxhzdk:25
## Exercises: part 3 (25 min)
- Check distribution of variables
- Is the data normally distributed?
- Make a visual inspection for the variable Potassium **(K)** and Calcium **(Ca)**
- Use a statistical test
- Apply transformations to normalize variables
- Let's do this for the variable Calcium **(Ca)**
- Apply transformations to linearize relationships
- Do this for the relationship between Iron **(Fe)** and Zinc **(Zn)**
## Check distribution of variables (1)
wzxhzdk:26
## Check distribution of variables (2)
wzxhzdk:27
## Check distribution of variables (3)
wzxhzdk:28
## Normalizing variables (1)
wzxhzdk:29
## Normalizing variables (2)
wzxhzdk:30
## Normalizing linear relationships (1)
wzxhzdk:31
## Normalizing linear relationships (2)
wzxhzdk:32
## Assignment 2
Access the assignment:
wzxhzdk:33
Remember to upload everything before **October 27, 12 am (= at noon!)**.
wardfont/edcpR documentation built on Dec. 23, 2021, 5:07 p.m.
R Package Documentation
Browse R Packages
We want your feedback!
Note that we can't provide technical support on individual packages. You should contact the package authors for that.
Embedding an R snippet on your website
Add the following code to your website.
For more information on customizing the embed code, read Embedding Snippets.
knitr::opts_chunk$set(echo = FALSE) library(DiagrammeR) library(knitr) library(kableExtra) rm("varechem_s2")
Feedback assignment 1 (1)
- don't include
install.packages(), do includelibrary(). - Give the objects we ask you to create exactly the same name as in the assignment.
- R is Capital-sensitive
- Don't forget to save the result as an object.
Know what to look for
Data type =
elements
- Character
- Numeric
- Integer
- Logical
Data structure =
how elements are ordered
- Factor
- Vector
- Matrix
- List
- Data frame
# Session 2: Data exploration {data-background=https://i.imgflip.com/105j5q.jpg data-background-size=cover}
## Get to know the data (1)
What kind of data did we get?
- What structure has the object?
- What data types are contained within the object?
- Do the structure and data types make sense?
- Are there NA-values or incorrect values?
Any fishy business?

## Plotting ...
{#id .class width=1000}
## ... can be very useful.
{#id .class width=900}
## Get to know the data (2)
What is the quality of the data? How should we interpret it?
Statistical tests:
- Normality?
- Outliers?
- ...
Apply necessary transformation if needed!
## Before we start
If you have difficulties with any aspects of working with R, don't hesitate to say so!
{#id .class height=300 width=500}
## Exercises for today
- Check the structure of the data
- Check NA and incorrect values
- Visualize your data
- Perform outlier analysis
- Check distribution of variables
- Apply transformations to normalize variables
- Apply transformations to linearize relationships
## Update your package
Update your "edcpR" pacakge using the script provided on Toledo `update-edcpR.R`
Find useful tips and function suggestions on the cheat-sheet vignette
wzxhzdk:1
## Exercises: part 1 (30 min)
Use the "varechem_s2" datast in the course package.
- Check the structure and data type of the data (and change in R if necessary)
- **Extra**: Try to assign meaningful levels for the variable *Managementtype*
- Check NA and incorrect values (and change in R if necessary)
- **TIP**: anyNA(), complete.cases(), ...
- Calculate summary metrics (min, max, mean, ...) to check for anomalies
- Visualize your data
- Try different types of graphs (scatterplot, histogram, boxplot...)
## Check structure of data (1)
wzxhzdk:2
## Check structure of data (2)
wzxhzdk:3
## Check structure of data (3)
wzxhzdk:4
## Check structure of data (4)
wzxhzdk:5
## Check structure of data (5)
wzxhzdk:6
## NA and incorrect values (1)
wzxhzdk:7
## NA and incorrect values (2)
wzxhzdk:8
## NA and incorrect values (3)
wzxhzdk:9
wzxhzdk:10
## NA and incorrect values (4)
wzxhzdk:11
## NA and incorrect values (5)
wzxhzdk:12
## NA and incorrect values (6)
wzxhzdk:13
## NA and incorrect values (7)
wzxhzdk:14
## NA and incorrect values (8)
wzxhzdk:15
## Visualize your data (1)
wzxhzdk:16
## Visualize your data (2)
wzxhzdk:17
## Visualize your data (3)
wzxhzdk:18
## Visualize your data (4)
wzxhzdk:19
## Exercises: part 2 (25 min)
- Perform outlier analysis
- for a univariate case: let's consider S
- for a multivariate case: let's consider P~K here
- do we have influential outliers?
- **TIP**: olsrr-package
## Perform outlier analysis (1)
wzxhzdk:20
## Perform outlier analysis (2)
wzxhzdk:21
## Perform outlier analysis (3)
wzxhzdk:22
## Perform outlier analysis (4)
wzxhzdk:23
## Perform outlier analysis (5)
wzxhzdk:24
## Perform outlier analysis (6)
wzxhzdk:25
## Exercises: part 3 (25 min)
- Check distribution of variables
- Is the data normally distributed?
- Make a visual inspection for the variable Potassium **(K)** and Calcium **(Ca)**
- Use a statistical test
- Apply transformations to normalize variables
- Let's do this for the variable Calcium **(Ca)**
- Apply transformations to linearize relationships
- Do this for the relationship between Iron **(Fe)** and Zinc **(Zn)**
## Check distribution of variables (1)
wzxhzdk:26
## Check distribution of variables (2)
wzxhzdk:27
## Check distribution of variables (3)
wzxhzdk:28
## Normalizing variables (1)
wzxhzdk:29
## Normalizing variables (2)
wzxhzdk:30
## Normalizing linear relationships (1)
wzxhzdk:31
## Normalizing linear relationships (2)
wzxhzdk:32
## Assignment 2
Access the assignment:
wzxhzdk:33
Remember to upload everything before **October 27, 12 am (= at noon!)**.
wardfont/edcpR documentation built on Dec. 23, 2021, 5:07 p.m.
R Package Documentation
Browse R Packages
We want your feedback!
Note that we can't provide technical support on individual packages. You should contact the package authors for that.
Embedding an R snippet on your website
Add the following code to your website.
For more information on customizing the embed code, read Embedding Snippets.