README.md
In wkmor1/msmod: Fit Multispecies Models
msmod

msmod is an R package for building statistical models of occupancy and abundance for more than one species at a time. So far, msmod includes the models described in
Pollock etal, 2012 and Pollock etal 2014
Install external dependencies
First install the software package JAGS, appropriate for your platform, from this link
Install R package dependencies
Now run the following:
for (i in c('arm', 'devtools', 'dplyr', 'ggplot2', 'lme4', 'MASS', 'mclust', 'R2jags', 'rstan'))
if(!require(i, char = TRUE)) install.packages(i)
Install msmod
Install msmod from this repository using devtools.
devtools::install_github('wkmor1/msmod')
Fitting multispecies models
Fitting a multispecies trait model as in Pollock etal, 2012
library(msmod)
head(eucs)
##   plot logit_rock   ln_mrvbf ln_prec_yr ln_cv_temp ln_rad_d21 sand  loam
## 1    1  0.3846743 -0.7874579   6.665684   4.955827   8.719972 TRUE FALSE
## 2    2  1.0330150 -0.7874579   6.665684   4.955827   8.719972 TRUE FALSE
## 3    3  0.8001193 -0.7874579   6.659294   4.955827   8.087321 TRUE FALSE
## 4    4 -0.3846743 -0.7874579   6.656727   4.955827   7.400395 TRUE FALSE
## 5    5 -1.6034499 -0.7874579   6.648985   4.955827   7.209399 TRUE FALSE
## 6    6  1.2950457 -0.7874579   6.734592   4.955827   8.520882 TRUE FALSE
## 1   FALSE       0.89  35.57    35     ALA
## 2   FALSE       0.89  35.57    35     ALA
## 3   FALSE       0.89  35.57    35     ALA
## 4   FALSE       0.89  35.57    35     ALA
## 5   FALSE       0.89  35.57    35     ALA
## 6   FALSE       0.89  35.57    35     ALA
msm_glmer <- msm(y = "present", sites = "plot", x = "logit_rock",
  species = "species", traits = "ln_sla", data = eucs, type = "mstm",
  method = "glmer")

summary(msm_glmer)
## Generalized linear mixed model fit by maximum likelihood (Laplace Approximation) [
## glmerMod]
## Family: binomial ( logit )
## Formula: present ~ logit_rock + logit_rock:ln_sla + (1 + logit_rock | species)
## Data: data
## Control: control
##
## AIC BIC logLik deviance df.resid
## 4661.8 4704.6 -2324.9 4649.8 9154
##
## Scaled residuals:
## Min 1Q Median 3Q Max
## -0.8182 -0.3615 -0.1997 -0.0736 15.3220
##
## Random effects:
## Groups Name Variance Std.Dev. Corr
## species (Intercept) 2.0924 1.4465
## logit_rock 0.6376 0.7985 -0.13
## Number of obs: 9160, groups: species, 20
##
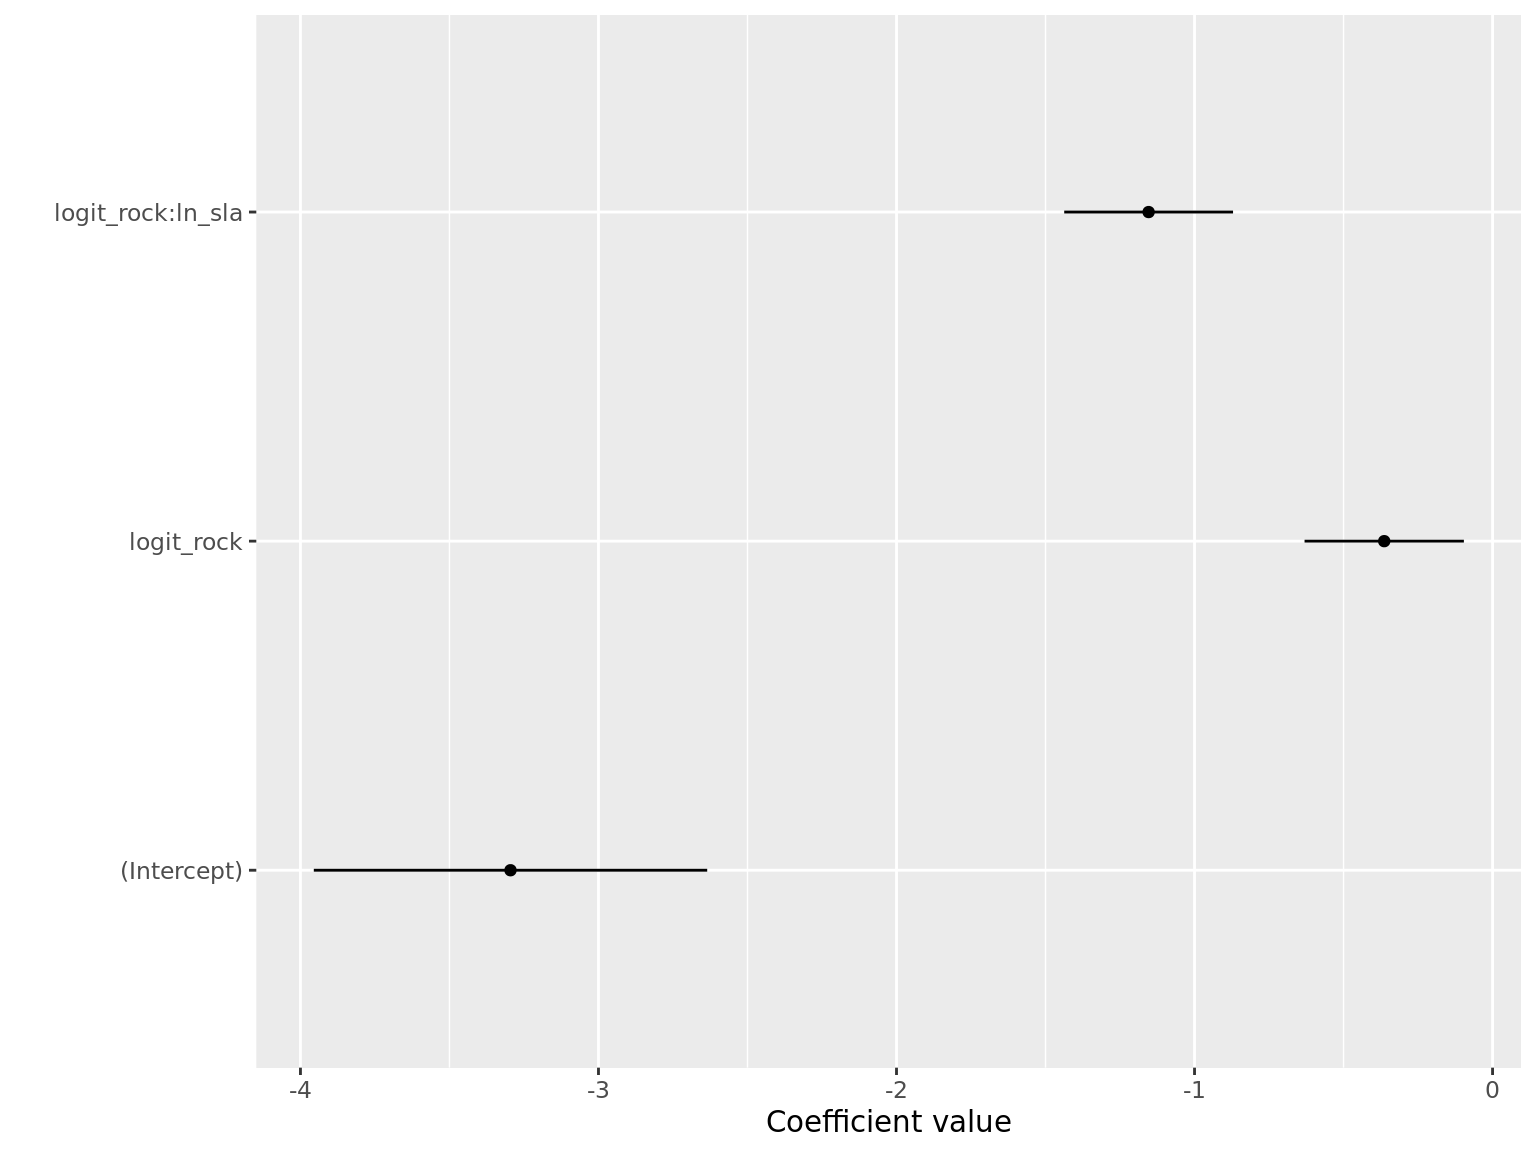
## Fixed effects:
## Estimate Std. Error z value Pr(>|z|)
## (Intercept) -3.2951 0.3367 -9.786 < 2e-16 ***
## logit_rock -0.7262 0.2724 -2.666 0.00768 **
## logit_rock:ln_sla -4.6150 0.5749 -8.027 9.97e-16 ***
## ---
## Signif. codes: 0 ‘***’ 0.001 ‘**’ 0.01 ‘*’ 0.05 ‘.’ 0.1 ‘ ’ 1
##
## Correlation of Fixed Effects:
## (Intr) lgt_rc
## logit_rock -0.006
## lgt_rck:ln_ 0.157 0.340
coef_plot(msm_glmer)
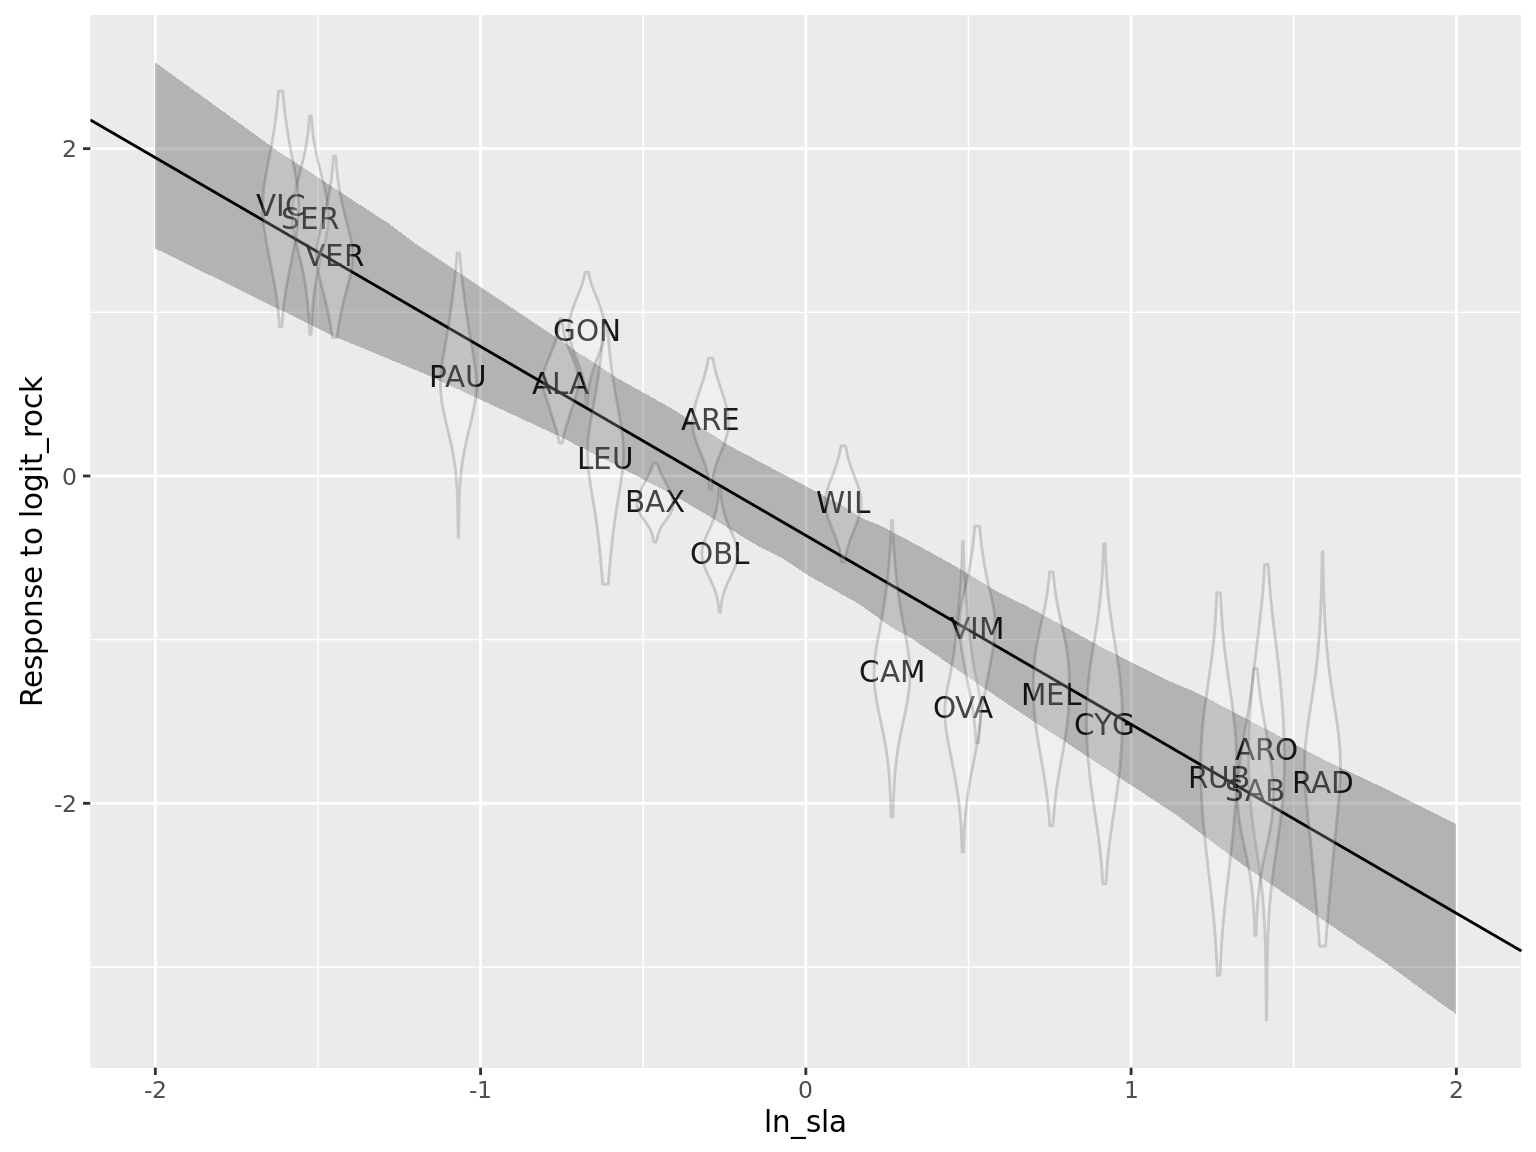
te_plot(msm_glmer, "logit_rock", "ln_sla")
wkmor1/msmod documentation built on May 4, 2019, 7:34 a.m.
R Package Documentation
Browse R Packages
We want your feedback!
Note that we can't provide technical support on individual packages. You should contact the package authors for that.
msmod
msmod is an R package for building statistical models of occupancy and abundance for more than one species at a time. So far, msmod includes the models described in Pollock etal, 2012 and Pollock etal 2014
Install external dependencies
First install the software package JAGS, appropriate for your platform, from this link
Install R package dependencies
Now run the following:
for (i in c('arm', 'devtools', 'dplyr', 'ggplot2', 'lme4', 'MASS', 'mclust', 'R2jags', 'rstan'))
if(!require(i, char = TRUE)) install.packages(i)
Install msmod
Install msmod from this repository using devtools.
devtools::install_github('wkmor1/msmod')
Fitting multispecies models
Fitting a multispecies trait model as in Pollock etal, 2012
library(msmod)
head(eucs)
## plot logit_rock ln_mrvbf ln_prec_yr ln_cv_temp ln_rad_d21 sand loam
## 1 1 0.3846743 -0.7874579 6.665684 4.955827 8.719972 TRUE FALSE
## 2 2 1.0330150 -0.7874579 6.665684 4.955827 8.719972 TRUE FALSE
## 3 3 0.8001193 -0.7874579 6.659294 4.955827 8.087321 TRUE FALSE
## 4 4 -0.3846743 -0.7874579 6.656727 4.955827 7.400395 TRUE FALSE
## 5 5 -1.6034499 -0.7874579 6.648985 4.955827 7.209399 TRUE FALSE
## 6 6 1.2950457 -0.7874579 6.734592 4.955827 8.520882 TRUE FALSE
## 1 FALSE 0.89 35.57 35 ALA
## 2 FALSE 0.89 35.57 35 ALA
## 3 FALSE 0.89 35.57 35 ALA
## 4 FALSE 0.89 35.57 35 ALA
## 5 FALSE 0.89 35.57 35 ALA
## 6 FALSE 0.89 35.57 35 ALA
msm_glmer <- msm(y = "present", sites = "plot", x = "logit_rock",
species = "species", traits = "ln_sla", data = eucs, type = "mstm",
method = "glmer")
summary(msm_glmer)
## Generalized linear mixed model fit by maximum likelihood (Laplace Approximation) [
## glmerMod]
## Family: binomial ( logit )
## Formula: present ~ logit_rock + logit_rock:ln_sla + (1 + logit_rock | species)
## Data: data
## Control: control
##
## AIC BIC logLik deviance df.resid
## 4661.8 4704.6 -2324.9 4649.8 9154
##
## Scaled residuals:
## Min 1Q Median 3Q Max
## -0.8182 -0.3615 -0.1997 -0.0736 15.3220
##
## Random effects:
## Groups Name Variance Std.Dev. Corr
## species (Intercept) 2.0924 1.4465
## logit_rock 0.6376 0.7985 -0.13
## Number of obs: 9160, groups: species, 20
##
## Fixed effects:
## Estimate Std. Error z value Pr(>|z|)
## (Intercept) -3.2951 0.3367 -9.786 < 2e-16 ***
## logit_rock -0.7262 0.2724 -2.666 0.00768 **
## logit_rock:ln_sla -4.6150 0.5749 -8.027 9.97e-16 ***
## ---
## Signif. codes: 0 ‘***’ 0.001 ‘**’ 0.01 ‘*’ 0.05 ‘.’ 0.1 ‘ ’ 1
##
## Correlation of Fixed Effects:
## (Intr) lgt_rc
## logit_rock -0.006
## lgt_rck:ln_ 0.157 0.340
coef_plot(msm_glmer)
te_plot(msm_glmer, "logit_rock", "ln_sla")
R Package Documentation
Browse R Packages
We want your feedback!
Note that we can't provide technical support on individual packages. You should contact the package authors for that.
Embedding an R snippet on your website
Add the following code to your website.
For more information on customizing the embed code, read Embedding Snippets.