README.md
In xiashen/TGCA: Total genetic contribution assessment
TGCA
Total genetic contribution assessment (TGCA) based on genome-wide summary association statistics.
Statistical Modeling
The TGCA analysis models the Z statistics from genome-wide association studies (GWAS) for each single genetic variant as drawn from a mixture of:

and thereafter makes inference on the TGCA parameter:

assessing the total genetic contribution of the variant on the analyzed set of phenotypes.
Setup
Start by installing the TGCA R package (v 1.0-0 tested), which works on all popular platforms including Windows, macOS, and Linux. We recommend directly install from GitHub via:
require(devtools)
install_github('https://github.com/xiashen/TGCA')
The installation should normally take less than 1 minute, as long as the internet connection has a reasonable speed. Then the package can be loaded via:
require(TGCA)
or
library(TGCA)
Example
Decorrelation of the phenotypic correlations estimated via GWAS summary statistics
In the R package, there is an embedded example dataset, which can be loaded as:
data(tgca)
Once loaded, three objects exist in the working space: tstat, MAF, and N, which contain a matrix of GWAS Z-scores for 1,996 SNPs and 122 traits, minor allele frequencies of these SNPs, and the sample sizes of these phenotypes (See also ?tgca). Such data are mandatory, the low-MAF SNPs will be used for a good estimate of the phenotypic correlation matrix based on the GWAS Z-scores (Shen et al. 2020). N is used for determining the weight on each phenotype, to avoid total genetic contribution assessment being dominated by a few powerful GWASed traits. The rownames of the tstat matrix are required, i.e., the SNP names.
tstat[1:5,1:5]
##                    134        135 2966_irnt 3761_irnt      2443
## rs375826246 -0.5767310  1.7772500  0.585063  0.885373  1.076920
## rs117619944  1.0435500  0.0123881 -1.835130  0.279999  1.144640
## rs1789089   -0.7954500 -0.5381990  0.710191  0.209710 -0.295909
## rs186756650 -2.9892300  1.0387600 -1.111360 -1.022240  0.123447
## rs1789088   -0.0372302 -1.1471900 -0.222836 -0.486009 -0.767688
head(MAF)
## rs375826246 rs117619944   rs1789089 rs186756650   rs1789088   rs1789087
##  0.00404353  0.03348060  0.48774500  0.00256649  0.05275140  0.34970100
head(N)
##      134       135 2966_irnt 3761_irnt      2443      2453
##   361136    361141     87024     72232    360192    359981
The matrix of GWAS Z-scores can be decorrelated via:
decor <- TGCA.decorrelate(tstat, N, MAF)
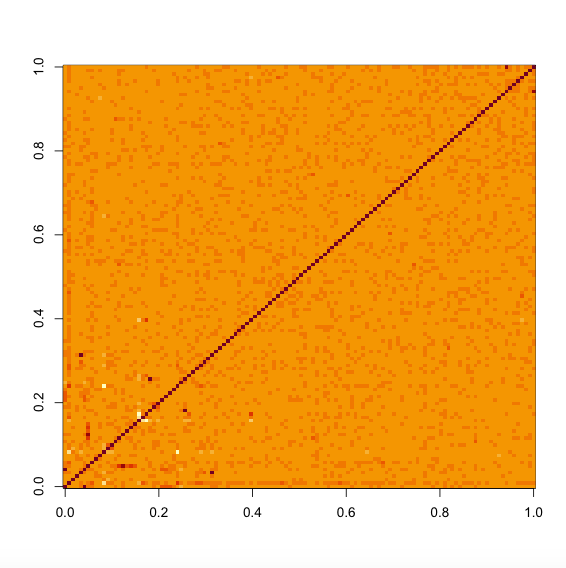
which uses all the SNPs with MAF < 5e-4 to estimate the phenotypic correlations (See also ?TGCA.decorrelate). If you don't have sufficient number of SNPs with such low MAFs, a MAF < 0.05 threshold is also fine for most analysis, which can be set via the argument maf.cut = 0.05. The returned object decor is a list with two elements, where z.decorrelated is the decorrelated Z-score matrix, and the number of columns was determined so that the eigenvectors therein capture 90% information of the original Z-score matrix. The cor.pheno element gives the estimated phenotypic correlation matrix.
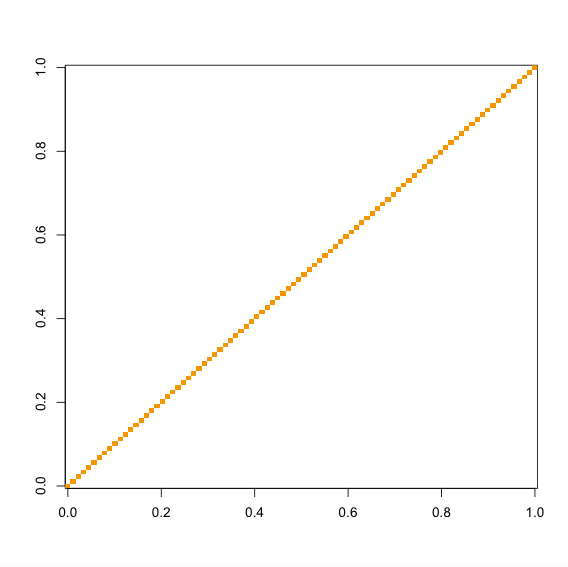
image(cor(decor$z.decorrelated))
image(decor$cor.pheno)
Total genetic contribution assessment across the SNPs
With the decorrelated Z-score matrix, we can apply the TGCA mixture model on each of the SNP with MAF > 5e-4 across the included set of phenotypes:
idx <- which(MAF < 5e-4)
zmat <- decor$z.decorrelated[-idx,]
res <- TGCA.scan(zmat)
This will take 2-3 minutes to complete. The returned result object res is a data frame, containing the estimated TGCA statistic $theta and every individual parameter in the mixture model. Additional columns in the same data frame provide the corresponding standard errors and p-values. Note that we emphasise the use of TGCA statistic $theta itself rather than its statistical inference based on the p-values.
head(res)[,1:6]
##                 theta.P   theta.est    theta.se         pi0.P       pi0.est     pi0.se
## rs375826246 0.844227512 0.421103262 2.143140101 7.1202925e-01 4.8024344e-01 1.30100692
## rs117619944 0.615133975 0.188594321 0.375119005 9.9999785e-01 4.1456785e-06 1.53765096
## rs1789089   0.813586488 0.085283405 0.361674140 1.5681319e-03 7.5724755e-01 0.23950112
## rs35305608  0.092087544 0.223738862 0.132823126 2.2767430e-01 3.8919665e-01 0.32261759
## rs34783785  0.018746482 0.208043503 0.088509028 6.0087478e-05 5.8482376e-01 0.14575167
## rs538737363 0.912468872 0.393878832 3.583160387 7.8154267e-01 5.1246755e-01 1.84800031
The link to our whole-genome TGCA analysis results for 5 different UK Biobank trait domains are provided in our paper (Li et al. 2020).
Reference
Li T, Ning Z, Yang Z, Zhai R, Xu W, Ying K, Wang Y, Chen Y, Shen X (2020). Total genetic contribution assessment across the human genome. Nature Communications, 12, 2845. https://www.nature.com/articles/s41467-021-23124-w
Li T, Ning Z, Shen X (2020). Improved estimation of phenotypic correlations using summary association statistics. Frontiers in Genetics, in press. On bioRxiv: https://www.biorxiv.org/content/10.1101/2020.12.10.419325v2
Contact
If you have questions, please feel free to email xia (dot) shen (at) ed (dot) ac (dot) uk.
xiashen/TGCA documentation built on July 4, 2021, 3:50 p.m.
R Package Documentation
Browse R Packages
We want your feedback!
Note that we can't provide technical support on individual packages. You should contact the package authors for that.
TGCA
Total genetic contribution assessment (TGCA) based on genome-wide summary association statistics.
Statistical Modeling
The TGCA analysis models the Z statistics from genome-wide association studies (GWAS) for each single genetic variant as drawn from a mixture of:
and thereafter makes inference on the TGCA parameter:
assessing the total genetic contribution of the variant on the analyzed set of phenotypes.
Setup
Start by installing the TGCA R package (v 1.0-0 tested), which works on all popular platforms including Windows, macOS, and Linux. We recommend directly install from GitHub via:
require(devtools)
install_github('https://github.com/xiashen/TGCA')
The installation should normally take less than 1 minute, as long as the internet connection has a reasonable speed. Then the package can be loaded via:
require(TGCA)
or
library(TGCA)
Example
Decorrelation of the phenotypic correlations estimated via GWAS summary statistics
In the R package, there is an embedded example dataset, which can be loaded as:
data(tgca)
Once loaded, three objects exist in the working space: tstat, MAF, and N, which contain a matrix of GWAS Z-scores for 1,996 SNPs and 122 traits, minor allele frequencies of these SNPs, and the sample sizes of these phenotypes (See also ?tgca). Such data are mandatory, the low-MAF SNPs will be used for a good estimate of the phenotypic correlation matrix based on the GWAS Z-scores (Shen et al. 2020). N is used for determining the weight on each phenotype, to avoid total genetic contribution assessment being dominated by a few powerful GWASed traits. The rownames of the tstat matrix are required, i.e., the SNP names.
tstat[1:5,1:5]
## 134 135 2966_irnt 3761_irnt 2443
## rs375826246 -0.5767310 1.7772500 0.585063 0.885373 1.076920
## rs117619944 1.0435500 0.0123881 -1.835130 0.279999 1.144640
## rs1789089 -0.7954500 -0.5381990 0.710191 0.209710 -0.295909
## rs186756650 -2.9892300 1.0387600 -1.111360 -1.022240 0.123447
## rs1789088 -0.0372302 -1.1471900 -0.222836 -0.486009 -0.767688
head(MAF)
## rs375826246 rs117619944 rs1789089 rs186756650 rs1789088 rs1789087
## 0.00404353 0.03348060 0.48774500 0.00256649 0.05275140 0.34970100
head(N)
## 134 135 2966_irnt 3761_irnt 2443 2453
## 361136 361141 87024 72232 360192 359981
The matrix of GWAS Z-scores can be decorrelated via:
decor <- TGCA.decorrelate(tstat, N, MAF)
which uses all the SNPs with MAF < 5e-4 to estimate the phenotypic correlations (See also ?TGCA.decorrelate). If you don't have sufficient number of SNPs with such low MAFs, a MAF < 0.05 threshold is also fine for most analysis, which can be set via the argument maf.cut = 0.05. The returned object decor is a list with two elements, where z.decorrelated is the decorrelated Z-score matrix, and the number of columns was determined so that the eigenvectors therein capture 90% information of the original Z-score matrix. The cor.pheno element gives the estimated phenotypic correlation matrix.
image(cor(decor$z.decorrelated))
image(decor$cor.pheno)
Total genetic contribution assessment across the SNPs
With the decorrelated Z-score matrix, we can apply the TGCA mixture model on each of the SNP with MAF > 5e-4 across the included set of phenotypes:
idx <- which(MAF < 5e-4)
zmat <- decor$z.decorrelated[-idx,]
res <- TGCA.scan(zmat)
This will take 2-3 minutes to complete. The returned result object res is a data frame, containing the estimated TGCA statistic $theta and every individual parameter in the mixture model. Additional columns in the same data frame provide the corresponding standard errors and p-values. Note that we emphasise the use of TGCA statistic $theta itself rather than its statistical inference based on the p-values.
head(res)[,1:6]
## theta.P theta.est theta.se pi0.P pi0.est pi0.se
## rs375826246 0.844227512 0.421103262 2.143140101 7.1202925e-01 4.8024344e-01 1.30100692
## rs117619944 0.615133975 0.188594321 0.375119005 9.9999785e-01 4.1456785e-06 1.53765096
## rs1789089 0.813586488 0.085283405 0.361674140 1.5681319e-03 7.5724755e-01 0.23950112
## rs35305608 0.092087544 0.223738862 0.132823126 2.2767430e-01 3.8919665e-01 0.32261759
## rs34783785 0.018746482 0.208043503 0.088509028 6.0087478e-05 5.8482376e-01 0.14575167
## rs538737363 0.912468872 0.393878832 3.583160387 7.8154267e-01 5.1246755e-01 1.84800031
The link to our whole-genome TGCA analysis results for 5 different UK Biobank trait domains are provided in our paper (Li et al. 2020).
Reference
Li T, Ning Z, Yang Z, Zhai R, Xu W, Ying K, Wang Y, Chen Y, Shen X (2020). Total genetic contribution assessment across the human genome. Nature Communications, 12, 2845. https://www.nature.com/articles/s41467-021-23124-w
Li T, Ning Z, Shen X (2020). Improved estimation of phenotypic correlations using summary association statistics. Frontiers in Genetics, in press. On bioRxiv: https://www.biorxiv.org/content/10.1101/2020.12.10.419325v2
Contact
If you have questions, please feel free to email xia (dot) shen (at) ed (dot) ac (dot) uk.
R Package Documentation
Browse R Packages
We want your feedback!
Note that we can't provide technical support on individual packages. You should contact the package authors for that.
Embedding an R snippet on your website
Add the following code to your website.
For more information on customizing the embed code, read Embedding Snippets.