README.md
In xioagedeningjinghai/scZCL: Zebrafish Cell Landscape
scZCL
A tool defines cell types in zebrafish based on single-cell digital expression
At first scZCL is a breif R package for large scale data(large DGE) from scZCL online function Zebrafish Cell Landscape ,to alleviate burdens of our main Server.
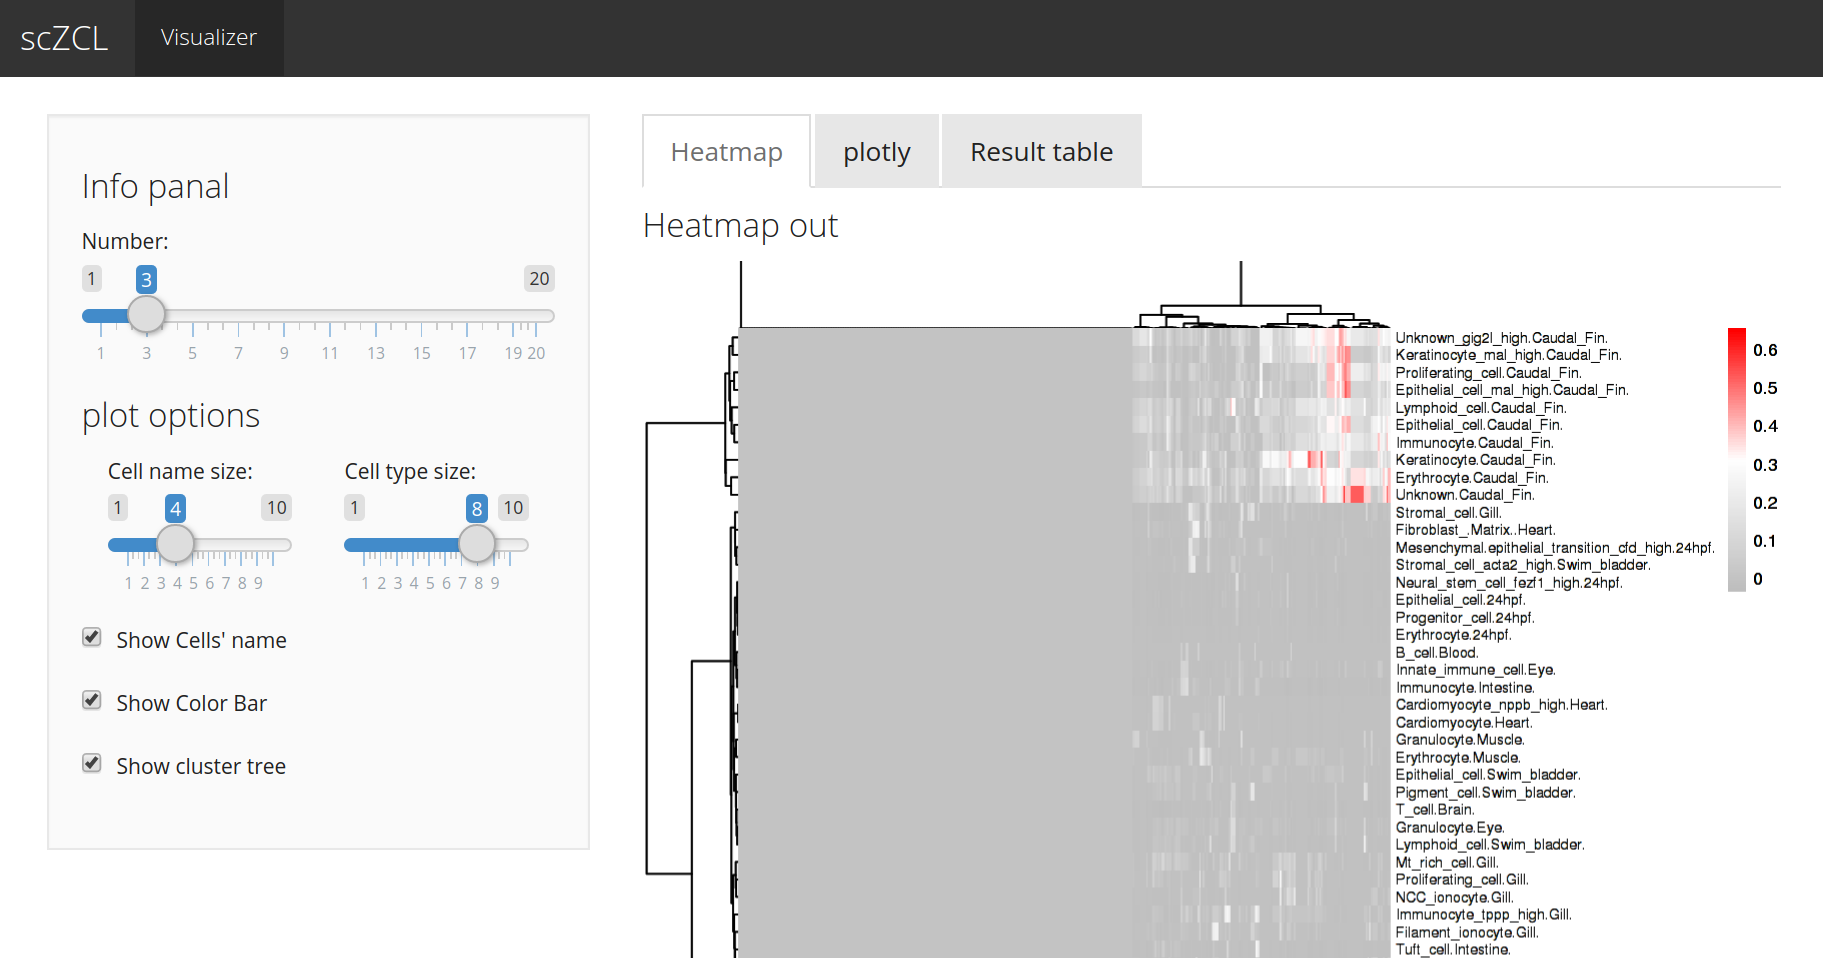
Now we add a UI for visulizing the scHCL reuslt.
Installation
#This require devtools
install.packages('devtools')
library(devtools)
# scZCL requires ggplot2/reshape2/plotly/shiny/shinythemes/shiny
install_github("xioagedeningjinghai/scZCL")
Quick Start
library(scZCL)
# zcl_caudalfin is an example expression matrix from ZCL project.
> data(zcl_caudalfin)
> dim(zcl_caudalfin)
[1] 2000   380
# 2000 genes expression value of 380 cells

# scZCL has two parameters , single cell expression matrix(scdata) and
# the number of most similar cell types
> zcl_result <- scZCL(scdata = zcl_caudalfin, numbers_plot = 3)
The return of scZCL() is a list which contains 4 parts.
cors_matrix: Pearson correlation coefficient matrix of each cell and cell type.
top_cors: equals to numbers_plot
scHCL: the most relevant cell type for each query cell
scHCL_probility: the top n relevant cell types for each query cell
# open shiny for visualize result for scHCL
scHCL_vis(hcl_result)
scZCL_vis() provides a bref function for visualizing and downloading of scZCL results
xioagedeningjinghai/scZCL documentation built on July 6, 2020, 12:29 a.m.
R Package Documentation
Browse R Packages
We want your feedback!
Note that we can't provide technical support on individual packages. You should contact the package authors for that.
scZCL
A tool defines cell types in zebrafish based on single-cell digital expression At first scZCL is a breif R package for large scale data(large DGE) from scZCL online function Zebrafish Cell Landscape ,to alleviate burdens of our main Server.
Now we add a UI for visulizing the scHCL reuslt.
Installation
#This require devtools
install.packages('devtools')
library(devtools)
# scZCL requires ggplot2/reshape2/plotly/shiny/shinythemes/shiny
install_github("xioagedeningjinghai/scZCL")
Quick Start
library(scZCL)
# zcl_caudalfin is an example expression matrix from ZCL project.
> data(zcl_caudalfin)
> dim(zcl_caudalfin)
[1] 2000 380
# 2000 genes expression value of 380 cells
# scZCL has two parameters , single cell expression matrix(scdata) and
# the number of most similar cell types
> zcl_result <- scZCL(scdata = zcl_caudalfin, numbers_plot = 3)
The return of scZCL() is a list which contains 4 parts. cors_matrix: Pearson correlation coefficient matrix of each cell and cell type. top_cors: equals to numbers_plot scHCL: the most relevant cell type for each query cell scHCL_probility: the top n relevant cell types for each query cell
# open shiny for visualize result for scHCL
scHCL_vis(hcl_result)
scZCL_vis() provides a bref function for visualizing and downloading of scZCL results
R Package Documentation
Browse R Packages
We want your feedback!
Note that we can't provide technical support on individual packages. You should contact the package authors for that.
Embedding an R snippet on your website
Add the following code to your website.
For more information on customizing the embed code, read Embedding Snippets.