In zambujo/swissparticipation: Swiss Participation in EU's Research Programmes
knitr::opts_chunk$set(
  dev = "svg",
  echo = FALSE,
  message = FALSE,
  warning = FALSE,
  comment = FALSE
)
Horizon Dashboard data on Horizon 2020 offers more details than the data in the previous framework programmes.
source(here::here("R", "package.r"))
source(here::here("R", "utils.r"))

# H2020 official figures
df <-
  here("data-raw", "horizon2020.xlsx") %>%
  read_excel() %>%
  clean_names() %>%
  rename(project_id = project_nbr,
         pic = general_pic) %>%
  mutate(
    legal_entity_type = str_sub(legal_entity_type, 1, 3),
    country_code = str_sub(country_code, 1, 2),
    # rename role
    partner_role = str_to_title(partner_role),
    pillar = str_extract(pillar_abbr, "\\d"),
    pillar = if_else(pillar_abbr == "EU.0.", "Cross-theme", pillar),
    pillar = if_else(pillar_abbr == "Euratom", pillar_abbr, pillar),
    partner_role = str_to_lower(partner_role),
    pillar = fct_inseq(pillar),
    pillar = fct_rev(pillar),
    pillar = fct_relevel(pillar, "Cross-theme", after = 0),
    pillar = fct_recode(
      pillar,
      I = "1",
      II = "2",
      III = "3",
      IV = "4",
      V = "5"
    ),
    org_type = fct_collapse(
      legal_entity_type,
      `Research & Education` = c("HES", "REC"),
      `Private Companies` = "PRC",
      `Others (Excl. R&Ed)` = c("PUB", "OTH")
    ),
    eu_contribution = str_replace(eu_contribution, fixed("-"), "0"),
    eu_contribution = as.numeric(eu_contribution),
    # country code
    country_code = str_replace(country_code, "KO", "XK"),
    # import dates
    signature_date = as.Date(signature_date, format = "%d/%m/%Y"),
    call_deadline_date = as.Date(call_deadline_date, format = "%d/%m/%Y"),
    signature_year = str_sub(signature_date, 1, 4),
    call_year = str_sub(call_deadline_date, 1, 4),
    signature_year = int(signature_year),
    call_year = int(call_year),
    call_semester = floor_date(call_deadline_date, "6 months")
  ) %>%
  # removing most international organizations (CERN, WHO, ...)
  filter(
    !str_detect(legal_name, "EUROPEAN|MONDIALE|WORLD") |
      !str_detect(legal_name, "ORGANIZATION|ORGANISATION|ASSOCIATION")
  )
Total EU Contribution by Pillar
budget_all <- df %>%
  mutate(pillar = fct_other(pillar, keep = chr(roman(1:5))),
         pillar = fct_relevel(pillar, "Other", after = 0)) %>%
  filter(!is.na(pillar)) %>%
  group_by(pillar) %>%
  summarise(size_pillar = sum(eu_contribution)) %>%
  mutate(
    share = 100 * prop.table(size_pillar),
    fp = "H2020",
    cube = "All Countries"
  )

budget_ch <- df %>%
  filter(country_code == "CH") %>%
  mutate(pillar = fct_other(pillar, keep = chr(roman(1:5))),
         pillar = fct_relevel(pillar, "Other", after = 0)) %>%
  filter(!is.na(pillar)) %>%
  group_by(pillar) %>%
  summarise(size_pillar = sum(eu_contribution)) %>%
  mutate(
    share = 100 * prop.table(size_pillar),
    fp = "H2020",
    cube = "Switzerland"
  )

pal <- c("#5298BD",
         "#FBBE5E",
         "#71B294",
         "#9D90B9",
         "#F08262",
         "#83D0F5")

budget_ch %>%
  bind_rows(budget_all) %>%
  mutate(
    cube = factor(cube),
    pillar = fct_recode(
      pillar,
      `I Excellent Science` = "I",
      `II Insdustrial Leadership` = "II",
      `III Societal Challenges` = "III",
      `IV Spreading Excellence and Widening Participation` = "IV",
      `V Science with and for Society` = "V",
      `Euratom + Cross-theme` = "Other"
    )
  ) %>%
  ggplot(aes(x = fp, y = share, fill = pillar)) +
  geom_col(position = position_stack()) +
  geom_text_repel(
    aes(label = sprintf("%.1f%%", share)),
    position = position_stack(vjust = .5, ),
    size = 4,
    alpha = 1,
    show.legend = FALSE,
    box.padding = .75,
    family = "Gill Sans"
  ) +
  coord_flip() +
  facet_wrap(cube ~ ., ncol = 1) +
  scale_fill_manual(
    values = rev(pal),
    guide = guide_legend(ncol = 2, reverse = TRUE)) +
  labs(x = NULL, y = NULL) +
  theme_minimal() +
  theme(
    legend.position = "top",
    panel.grid.major = element_blank(),
    panel.grid.minor = element_blank(),
    strip.text.x = element_text(size = 15),
    legend.title = element_blank(),
    axis.text.x = element_blank(),
    axis.ticks.x = element_blank(),
    axis.text.y = element_blank(),
    axis.ticks.y = element_blank(),
    text = element_text(
      size = 14,
      family = "Gill Sans",
      color = "gray10"
    )
  )
# find and sort top participants
top_participants <- df %>%
  group_by(Country = country) %>%
  summarise(contrib_country = sum(eu_contribution, na.rm = TRUE)) %>%
  ungroup() %>%
  arrange(desc(contrib_country))

ch_rank <- which(pull(top_participants, Country) == "Switzerland")

country_participation <- df %>%
  group_by(
    Country = country,
    `Call Year` = call_year,
    Type = org_type
  ) %>%
  summarise(
    `Participation Count` = n(),
    `Nb Projects` = n_distinct(project_id),
    `EU Contribution` = sum(eu_contribution, na.rm = TRUE)
  ) %>%
  ungroup() %>%
  arrange(`Type`, `Call Year`)
Overview
Swiss participation in H2020: participation count, number of projects (distinct), total EU contribution by pillar, thematic priority, and call year.
df %>%
  filter(country_code == "CH") %>%
  get_participation()
Areas (Thematic Priorities) {.tabset .tabset-fade .tabset-pills}
The below Figure 4 updates Figure 17 in page 30. Figure 4 (Original) is the latest update provided in the SERI page. Figure 4 (Updated) shows the latest H2020 dashboard data. (For comparison, only the 20 top participation areas are shown.)
Figure 4 (Updated)
get_contrib_area <- function(x) {
  x <- x %>%
    filter(framework_programme == "H2020") %>%
    filter(!is.na(thematic_priority_abbr))

  to_all <- x %>%
    group_by(Area = thematic_priority_abbr) %>%
    summarise(contrib = sum(eu_contribution, na.rm = TRUE)) %>%
    mutate(
      share = contrib / sum(contrib),
      context = "Total")
  to_ch <- x %>%
    filter(country_code == "CH") %>%
    group_by(Area = thematic_priority_abbr) %>%
    summarise(contrib = sum(eu_contribution, na.rm = TRUE)) %>%
    mutate(
      share = contrib / sum(contrib),
      context = "CH")

  dplyr::bind_rows(to_all, to_ch)
}

pillar_area_lookup <- df %>%
  filter(framework_programme == "H2020") %>%
  count(Pillar = pillar, Area = thematic_priority_abbr) %>%
  filter(!is.na(Area)) %>%
  select(-n)

area_labels <- df %>%
  get_contrib_area() %>%
  filter(context == "CH") %>%
  left_join(pillar_area_lookup, by = "Area") %>%
  arrange(desc(contrib)) %>%
  slice_head(n = 20) %>%
  arrange(desc(Pillar), desc(contrib)) %>%
  select(Area)

contribs <- df %>%
  get_contrib_area() %>%
  select(-share) %>%
  mutate(
    contrib = round(1e-6 * contrib, 1),
    contrib = format(contrib, big.mark = "'", decimal.mark = ".", trim = TRUE))

pal <- c("#B91646", "#DFD8CA")

area_labels %>%
  left_join(get_contrib_area(df), by = "Area") %>%
  select(-contrib) %>%
  pivot_wider(names_from = context, values_from = share) %>%
  pivot_longer(
    cols = c("Total", "CH"),
    names_to = "context",
    values_to = "share") %>%
  left_join(contribs, by = c("Area", "context")) %>%
  mutate(
    context = str_replace(context, "CH", "Swiss Institutions"),
    context = str_replace(context, "Total", "All Institutions"),
    context = fct_rev(context),
    Area = str_remove(Area, "LEIT-"),
    Area = str_remove(Area, "INNOSUP"),
    Area = fct_inorder(Area),
    Area = fct_rev(Area)) %>%
  ggplot(aes(x = Area, y = share, fill = fct_rev(context))) +
  geom_bar(stat = "identity", width = .7, position = "dodge") +
  geom_text(
    aes(label = contrib),
    position = position_dodge(width = .9),
    hjust = -.25,
    size = 3.5,
    family = "Gill Sans"
  ) +
  coord_flip() +
  scale_fill_manual(values = rev(pal), guide = guide_legend(reverse = TRUE)) +
  scale_y_continuous(labels = percent_format(accuracy = 1), expand = c(.1, 0)) +
  theme_minimal() +
  labs(
    title = "Funding by Programme Area Under H2020",
    subtitle = "(MioEUR)") +
  theme(
    text = element_text(size = 14, family = "Gill Sans", color = "gray10"),
    plot.title.position = "plot",
    legend.position = "top",
    legend.title = element_blank(),
    legend.key.size = unit(0.8, "line"),
    panel.grid.major.y = element_blank(),
    axis.title.x = element_blank(),
    axis.title.y = element_blank(),
    axis.text.y = element_text(margin = margin(0, -25, 0, 0)))
Figure 4 (Original)
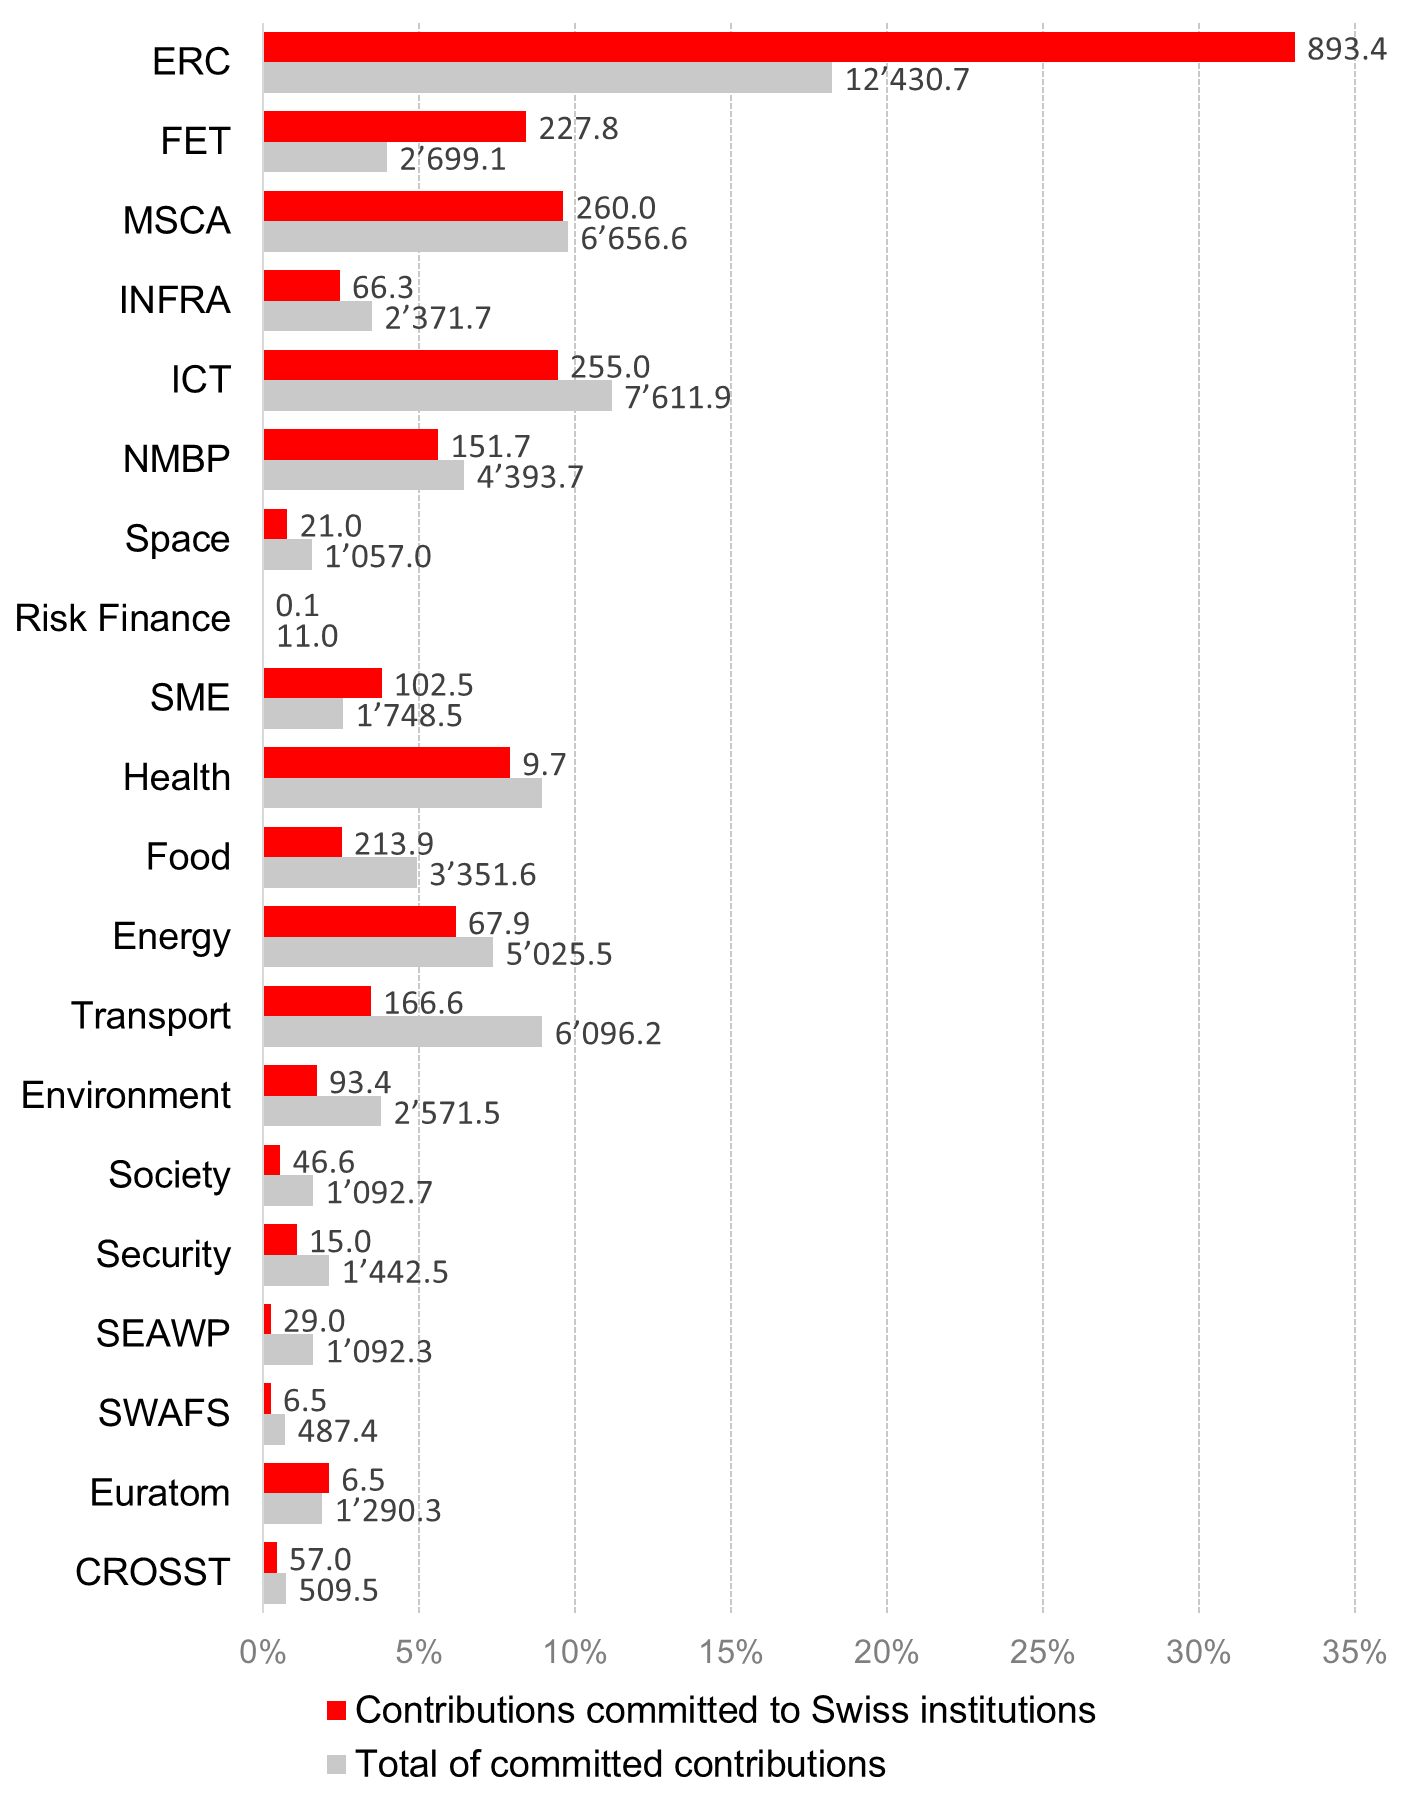
Source: Figure 4. Funding under by programme area (CHF m), in relation to total funding
Participation by Sector
EU Contribution to Swiss Institutions in Research and HigherEd
df %>%
  filter(country_code == "CH") %>%
  filter(org_type == "Research & Education") %>%
  get_participation()
Relative Semester Distribution of EU Contribution
pal <- c("#800000", "#767676")

ch <- df %>%
  filter(!is.na(call_deadline_date)) %>%
  filter(!is.na(org_type)) %>%
  filter(country_code == "CH") %>%
  group_by(Country = country, org_type, Semester = call_semester) %>%
  summarise(contrib = sum(eu_contribution, na.rm = TRUE)) %>%
  ungroup() %>%
  mutate(Share = 100 * contrib / sum(contrib))

rest <- df %>%
  filter(!is.na(call_deadline_date)) %>%
  filter(!is.na(org_type)) %>%
  filter(!country_code %in% c("CH")) %>%
  mutate(
    call_semester = floor_date(call_deadline_date, "6 months")) %>%
  group_by(org_type, Semester = call_semester) %>%
  summarise(contrib = sum(eu_contribution, na.rm = TRUE)) %>%
  ungroup() %>%
  mutate(
    Share = 100 * contrib / sum(contrib),
    Country = "Remaining Countries") %>%
  relocate(Country)


combined <- ch %>%
  bind_rows(rest) %>%
  mutate(
    Country = factor(Country,
                     levels = c("Switzerland", "Remaining")),
    org_type = fct_relevel(org_type, "Others (Excl. R&Ed)", after = Inf)
  )

combined %>%
  ggplot(aes(x = Semester, y = Share, fill = Country)) +
  geom_bar(
    stat = "identity",
    width = 120,
    position = position_dodge(width = 128)) +
  labs(
    title = "Time Distribution of EU Contribution by Institution Sector",
    subtitle = glue(
      "<span style='color:{pal[1]};'>**Switzerland**</span> ",
      "vs <span style='color:{pal[2]};weight: bold;'>",
      "**Remaining Countries**</span>"
    ),
    x = "Call Semester",
    y = "%"
  ) +
  scale_fill_manual(values = pal, guide = "none") +
  facet_wrap(org_type ~ ., ncol = 1) +
  theme_minimal() +
  theme(
    plot.title.position = "plot",
    plot.subtitle = element_markdown(),
    text = element_text(
      size = 14,
      family = "Gill Sans",
      color = "gray10"
    )
  )
Country Participation Profiles {.tabset .tabset-fade .tabset-pills}
Excellent Science/Research and HigherEd
pal <- c(
  rep("#767676", ch_rank - 1),
  "#800000",
  rep("#767676", 15 - ch_rank))

## share to Pillar I
contribution_share_pillar <- df %>%
  filter(!is.na(pillar)) %>%
  semi_join(top_participants %>%
    select(country = Country) %>%
    head(15),
  by = "country"
  ) %>%
  group_by(
    Country = country,
    Pillar = pillar
  ) %>%
  summarise(`Contribution` = sum(eu_contribution)) %>%
  mutate(share_pillar = 100 * prop.table(Contribution)) %>%
  filter(Pillar == "I") %>%
  select(-Pillar, -Contribution)

## share to Resesearch and HigherEd
contribution_share_reshed <- df %>%
  filter(!is.na(pillar)) %>%
  semi_join(top_participants %>%
    select(country = Country) %>%
    head(15),
  by = "country"
  ) %>%
  group_by(
    Country = country,
    Type = org_type
  ) %>%
  summarise(`Contribution` = sum(eu_contribution)) %>%
  mutate(share_reshed = 100 * prop.table(Contribution)) %>%
  filter(Type == "Research & Education") %>%
  select(-Type, -Contribution)

top_participants %>%
  inner_join(contribution_share_reshed, by = c("Country")) %>%
  inner_join(contribution_share_pillar, by = c("Country")) %>%
  mutate(
    Country = fct_rev(fct_inorder(Country)),
    contrib_country = contrib_country / 1000000
  ) %>%
  ggplot(
    aes(
      x = share_pillar,
      y = share_reshed,
      label = Country,
      col = Country,
      size = contrib_country)) +
  geom_point(fill = NA) +
  geom_text_repel(
    size = 5,
    show.legend = FALSE,
    box.padding = .75,
    family = "Gill Sans") +
  guides(size = guide_legend(
    title = "Total EU Contribution (MioEUR) :",
    override.aes = list(fill = "gray45", col = "gray45", shape = 21))) +
  labs(
    x = glue("Contributions to Pillar I: ",
             "Excellent Science\n",
             "(% of the total contribution to the country)"),
    y = glue("Contribution to Institutions in Research and HigherEd\n",
             "(% of the total contribution to the country)")) +
  scale_color_manual(values = rev(pal), guide = "none") +
  theme_minimal() +
  theme(
    text = element_text(size = 15, family = "Gill Sans", color = "gray10"),
    plot.title.position = "plot",
    legend.position = "top")
Industrial Leadership/Private Sector
pal <- c(
  rep("#767676", ch_rank - 1),
  "#800000",
  rep("#767676", 15 - ch_rank))

## share to Pillar II
contribution_share_pillar <- df %>%
  filter(!is.na(pillar)) %>%
  semi_join(top_participants %>%
    select(country = Country) %>%
    head(15),
  by = "country"
  ) %>%
  group_by(
    Country = country,
    Pillar = pillar
  ) %>%
  summarise(`Contribution` = sum(eu_contribution)) %>%
  mutate(share_pillar = 100 * prop.table(Contribution)) %>%
  filter(Pillar == "II") %>%
  select(-Pillar, -Contribution)

## share to Resesearch and HigherEd
contribution_share_prc <- df %>%
  filter(!is.na(pillar)) %>%
  semi_join(top_participants %>%
    select(country = Country) %>%
    head(15),
  by = "country"
  ) %>%
  group_by(
    Country = country,
    Type = legal_entity_type
  ) %>%
  summarise(`Contribution` = sum(eu_contribution)) %>%
  mutate(share_reshed = 100 * prop.table(Contribution)) %>%
  filter(Type == "PRC") %>%
  select(-Type, -Contribution)

top_participants %>%
  inner_join(contribution_share_prc, by = c("Country")) %>%
  inner_join(contribution_share_pillar, by = c("Country")) %>%
  mutate(
    Country = fct_rev(fct_inorder(Country)),
    contrib_country = contrib_country / 1000000
  ) %>%
  ggplot(
    aes(
      x = share_pillar,
      y = share_reshed,
      label = Country,
      col = Country,
      size = contrib_country)) +
  geom_point(fill = NA) +
  geom_text_repel(
    size = 5,
    show.legend = FALSE,
    box.padding = .75,
    family = "Gill Sans") +
  guides(size = guide_legend(
    title = "Total EU Contribution (MioEUR) :",
    override.aes = list(fill = "gray45", col = "gray45", shape = 21))) +
  labs(
    x = glue("Contributions to Pillar II: ",
             "Industrial Leadership\n",
             "(% of the total contribution to the country)"),
    y = glue("Contribution to Private Companies\n",
             "(% of the total contribution to the country)")) +
  scale_color_manual(values = rev(pal), guide = "none") +
  theme_minimal() +
  theme(
    text = element_text(size = 15, family = "Gill Sans", color = "gray10"),
    plot.title.position = "plot",
    legend.position = "top")
Annex
Top Recipients
Top 30 in Research and Higher Education
df %>%
  filter(country_code == "CH") %>%
  filter(org_type == "Research & Education") %>%
  group_by(Institution = legal_name) %>%
  summarise(
    `Nb Projects` = n_distinct(project_id),
    `EU Contribution` = sum(eu_contribution, na.rm = TRUE)
  ) %>%
  arrange(desc(`EU Contribution`)) %>%
  mutate(Institution = str_to_title(Institution)) %>%
  slice_head(n = 30) %>%
  reactable(
    columns = list(
      `Nb Projects` = colDef(sortable = TRUE),
      `EU Contribution` = colDef(
        sortable = TRUE,
        format = colFormat(
          currency = "EUR",
          separators = TRUE,
          digits = 2
        )
      )
    ),
    highlight = TRUE,
    searchable = TRUE,
    sortable = FALSE,
    showSortable = TRUE,
    compact = TRUE,
    minRows = 10
  )
Top 30 not in Private Companies
df %>%
  filter(country_code == "CH") %>%
  filter(org_type == "Private Companies") %>%
  group_by(Institution = legal_name) %>%
  summarise(
    `Nb Projects` = n_distinct(project_id),
    `EU Contribution` = sum(eu_contribution, na.rm = TRUE)
  ) %>%
  arrange(desc(`EU Contribution`)) %>%
  mutate(Institution = str_to_title(Institution)) %>%
  slice_head(n = 30) %>%
  reactable(
    columns = list(
      `Nb Projects` = colDef(sortable = TRUE),
      `EU Contribution` = colDef(
        sortable = TRUE,
        format = colFormat(
          currency = "EUR",
          separators = TRUE,
          digits = 2
        )
      )
    ),
    highlight = TRUE,
    searchable = TRUE,
    sortable = FALSE,
    showSortable = TRUE,
    compact = TRUE,
    minRows = 10
  )
Top 30 not in Others (Excl. R&Ed)
df %>%
  filter(country_code == "CH") %>%
  filter(org_type == "Others (Excl. R&Ed)") %>%
  group_by(Institution = legal_name) %>%
  summarise(
    `Nb Projects` = n_distinct(project_id),
    `EU Contribution` = sum(eu_contribution, na.rm = TRUE)
  ) %>%
  arrange(desc(`EU Contribution`)) %>%
  mutate(Institution = str_to_title(Institution)) %>%
  slice_head(n = 30) %>%
  reactable(
    columns = list(
      `Nb Projects` = colDef(sortable = TRUE),
      `EU Contribution` = colDef(
        sortable = TRUE,
        format = colFormat(
          currency = "EUR",
          separators = TRUE,
          digits = 2
        )
      )
    ),
    highlight = TRUE,
    searchable = TRUE,
    sortable = FALSE,
    showSortable = TRUE,
    compact = TRUE,
    minRows = 10
  )
# Differentiate pillars I to III
stats_depth_1 <- df %>%
  filter(!is.na(pillar)) %>%
  filter(country_code == "CH") %>%
  filter(!pillar %in% chr(roman(1:3))) %>%
  mutate(pillar = fct_rev(pillar)) %>%
  group_by(pillar, pillar_descr) %>%
  summarise(total_eu_contrib = sum(eu_contribution)) %>%
  ungroup() %>%
  # for printing
  mutate(
    pillar_descr = ifelse(
      chr(pillar) %in% chr(roman(4:5)),
      str_c(pillar, ". ", pillar_descr),
      chr(pillar)
    ),
    thematic_priority_abbr = NA
  ) %>%
  # for binding
  select(
    pillar = pillar_descr,
    thematic_priority = thematic_priority_abbr,
    contrib = total_eu_contrib
  )

stats_depth_2 <- df %>%
  filter(!is.na(pillar)) %>%
  filter(country_code == "CH") %>%
  filter(pillar %in% chr(roman(1:3))) %>%
  mutate(pillar = fct_rev(pillar)) %>%
  group_by(pillar, pillar_descr, thematic_priority_abbr) %>%
  summarise(total_eu_contrib = sum(eu_contribution)) %>%
  ungroup() %>%
  mutate(thematic_priority_abbr = case_when(
    total_eu_contrib < 500000000 ~ "OTHER",
    TRUE ~ as.character(thematic_priority_abbr)
  )) %>%
  group_by(pillar, pillar_descr, thematic_priority_abbr) %>%
  summarise(total_eu_contrib = sum(total_eu_contrib)) %>%
  ungroup() %>%
  unite("pillar", starts_with("pillar"), sep = ". ") %>%
  # for binding
  select(pillar,
    thematic_priority = thematic_priority_abbr,
    contrib = total_eu_contrib
  )

stats_depth_2 %>%
  bind_rows(stats_depth_1) %>%
  mutate(
    thematic_priority = replace_na(thematic_priority, ""),
    contrib_txt = contrib / 1000000,
    contrib_txt = format(
      contrib_txt,
      big.mark = ",",
      decimal.mark = ".",
      trim = TRUE,
      digits = 2
    ),
    contrib_txt = str_c("M€", contrib_txt)
  ) %>%
  write_csv(here("data", "treemap-h2020-ch.csv"))
# plot with https://rawgraphs.io
he <- tibble(
  pillar = c(
    "Excellent Science",
    "Excellent Science",
    "Excellent Science",
    "Industrial Competitiveness",
    "Industrial Competitiveness",
    "Industrial Competitiveness",
    "Industrial Competitiveness",
    "Industrial Competitiveness",
    "Industrial Competitiveness",
    "Industrial Competitiveness",
    "Innovative Europe",
    "Innovative Europe",
    "Innovative Europe",
    "Widening ERA",
    "Widening ERA"
  ),
  thematic_priority = c(
    "ERC",
    "MSCA",
    "INFRA",
    "HEALTH",
    "CULTURE",
    "SECURITY",
    "SPACE",
    "ENERGY",
    "FOOD",
    "JRC",
    "EIC",
    "ECOSYSTEMS",
    "EIT",
    "SPREAD",
    "RISYS"
  ),
  contrib = c(
    16004,
    6602,
    2406,
    8256,
    2280,
    1596,
    15349,
    15123,
    8952,
    1970,
    10105,
    527,
    2965,
    2955,
    438
  )
)

he %>%
  group_by(pillar) %>%
  summarise(total_contrib = sum(contrib)) %>%
  mutate(share_contrib = 100 * prop.table(total_contrib))

write_csv(he, here("data", "treemap-he.csv"))
zambujo/swissparticipation documentation built on May 11, 2022, 1:40 a.m.
R Package Documentation
Browse R Packages
We want your feedback!
Note that we can't provide technical support on individual packages. You should contact the package authors for that.
knitr::opts_chunk$set( dev = "svg", echo = FALSE, message = FALSE, warning = FALSE, comment = FALSE )
Horizon Dashboard data on Horizon 2020 offers more details than the data in the previous framework programmes.
source(here::here("R", "package.r")) source(here::here("R", "utils.r")) # H2020 official figures df <- here("data-raw", "horizon2020.xlsx") %>% read_excel() %>% clean_names() %>% rename(project_id = project_nbr, pic = general_pic) %>% mutate( legal_entity_type = str_sub(legal_entity_type, 1, 3), country_code = str_sub(country_code, 1, 2), # rename role partner_role = str_to_title(partner_role), pillar = str_extract(pillar_abbr, "\\d"), pillar = if_else(pillar_abbr == "EU.0.", "Cross-theme", pillar), pillar = if_else(pillar_abbr == "Euratom", pillar_abbr, pillar), partner_role = str_to_lower(partner_role), pillar = fct_inseq(pillar), pillar = fct_rev(pillar), pillar = fct_relevel(pillar, "Cross-theme", after = 0), pillar = fct_recode( pillar, I = "1", II = "2", III = "3", IV = "4", V = "5" ), org_type = fct_collapse( legal_entity_type, `Research & Education` = c("HES", "REC"), `Private Companies` = "PRC", `Others (Excl. R&Ed)` = c("PUB", "OTH") ), eu_contribution = str_replace(eu_contribution, fixed("-"), "0"), eu_contribution = as.numeric(eu_contribution), # country code country_code = str_replace(country_code, "KO", "XK"), # import dates signature_date = as.Date(signature_date, format = "%d/%m/%Y"), call_deadline_date = as.Date(call_deadline_date, format = "%d/%m/%Y"), signature_year = str_sub(signature_date, 1, 4), call_year = str_sub(call_deadline_date, 1, 4), signature_year = int(signature_year), call_year = int(call_year), call_semester = floor_date(call_deadline_date, "6 months") ) %>% # removing most international organizations (CERN, WHO, ...) filter( !str_detect(legal_name, "EUROPEAN|MONDIALE|WORLD") | !str_detect(legal_name, "ORGANIZATION|ORGANISATION|ASSOCIATION") )
Total EU Contribution by Pillar
budget_all <- df %>% mutate(pillar = fct_other(pillar, keep = chr(roman(1:5))), pillar = fct_relevel(pillar, "Other", after = 0)) %>% filter(!is.na(pillar)) %>% group_by(pillar) %>% summarise(size_pillar = sum(eu_contribution)) %>% mutate( share = 100 * prop.table(size_pillar), fp = "H2020", cube = "All Countries" ) budget_ch <- df %>% filter(country_code == "CH") %>% mutate(pillar = fct_other(pillar, keep = chr(roman(1:5))), pillar = fct_relevel(pillar, "Other", after = 0)) %>% filter(!is.na(pillar)) %>% group_by(pillar) %>% summarise(size_pillar = sum(eu_contribution)) %>% mutate( share = 100 * prop.table(size_pillar), fp = "H2020", cube = "Switzerland" ) pal <- c("#5298BD", "#FBBE5E", "#71B294", "#9D90B9", "#F08262", "#83D0F5") budget_ch %>% bind_rows(budget_all) %>% mutate( cube = factor(cube), pillar = fct_recode( pillar, `I Excellent Science` = "I", `II Insdustrial Leadership` = "II", `III Societal Challenges` = "III", `IV Spreading Excellence and Widening Participation` = "IV", `V Science with and for Society` = "V", `Euratom + Cross-theme` = "Other" ) ) %>% ggplot(aes(x = fp, y = share, fill = pillar)) + geom_col(position = position_stack()) + geom_text_repel( aes(label = sprintf("%.1f%%", share)), position = position_stack(vjust = .5, ), size = 4, alpha = 1, show.legend = FALSE, box.padding = .75, family = "Gill Sans" ) + coord_flip() + facet_wrap(cube ~ ., ncol = 1) + scale_fill_manual( values = rev(pal), guide = guide_legend(ncol = 2, reverse = TRUE)) + labs(x = NULL, y = NULL) + theme_minimal() + theme( legend.position = "top", panel.grid.major = element_blank(), panel.grid.minor = element_blank(), strip.text.x = element_text(size = 15), legend.title = element_blank(), axis.text.x = element_blank(), axis.ticks.x = element_blank(), axis.text.y = element_blank(), axis.ticks.y = element_blank(), text = element_text( size = 14, family = "Gill Sans", color = "gray10" ) )
# find and sort top participants top_participants <- df %>% group_by(Country = country) %>% summarise(contrib_country = sum(eu_contribution, na.rm = TRUE)) %>% ungroup() %>% arrange(desc(contrib_country)) ch_rank <- which(pull(top_participants, Country) == "Switzerland") country_participation <- df %>% group_by( Country = country, `Call Year` = call_year, Type = org_type ) %>% summarise( `Participation Count` = n(), `Nb Projects` = n_distinct(project_id), `EU Contribution` = sum(eu_contribution, na.rm = TRUE) ) %>% ungroup() %>% arrange(`Type`, `Call Year`)
Overview
Swiss participation in H2020: participation count, number of projects (distinct), total EU contribution by pillar, thematic priority, and call year.
df %>% filter(country_code == "CH") %>% get_participation()
Areas (Thematic Priorities) {.tabset .tabset-fade .tabset-pills}
The below Figure 4 updates Figure 17 in page 30. Figure 4 (Original) is the latest update provided in the SERI page. Figure 4 (Updated) shows the latest H2020 dashboard data. (For comparison, only the 20 top participation areas are shown.)
Figure 4 (Updated)
get_contrib_area <- function(x) { x <- x %>% filter(framework_programme == "H2020") %>% filter(!is.na(thematic_priority_abbr)) to_all <- x %>% group_by(Area = thematic_priority_abbr) %>% summarise(contrib = sum(eu_contribution, na.rm = TRUE)) %>% mutate( share = contrib / sum(contrib), context = "Total") to_ch <- x %>% filter(country_code == "CH") %>% group_by(Area = thematic_priority_abbr) %>% summarise(contrib = sum(eu_contribution, na.rm = TRUE)) %>% mutate( share = contrib / sum(contrib), context = "CH") dplyr::bind_rows(to_all, to_ch) } pillar_area_lookup <- df %>% filter(framework_programme == "H2020") %>% count(Pillar = pillar, Area = thematic_priority_abbr) %>% filter(!is.na(Area)) %>% select(-n) area_labels <- df %>% get_contrib_area() %>% filter(context == "CH") %>% left_join(pillar_area_lookup, by = "Area") %>% arrange(desc(contrib)) %>% slice_head(n = 20) %>% arrange(desc(Pillar), desc(contrib)) %>% select(Area) contribs <- df %>% get_contrib_area() %>% select(-share) %>% mutate( contrib = round(1e-6 * contrib, 1), contrib = format(contrib, big.mark = "'", decimal.mark = ".", trim = TRUE)) pal <- c("#B91646", "#DFD8CA") area_labels %>% left_join(get_contrib_area(df), by = "Area") %>% select(-contrib) %>% pivot_wider(names_from = context, values_from = share) %>% pivot_longer( cols = c("Total", "CH"), names_to = "context", values_to = "share") %>% left_join(contribs, by = c("Area", "context")) %>% mutate( context = str_replace(context, "CH", "Swiss Institutions"), context = str_replace(context, "Total", "All Institutions"), context = fct_rev(context), Area = str_remove(Area, "LEIT-"), Area = str_remove(Area, "INNOSUP"), Area = fct_inorder(Area), Area = fct_rev(Area)) %>% ggplot(aes(x = Area, y = share, fill = fct_rev(context))) + geom_bar(stat = "identity", width = .7, position = "dodge") + geom_text( aes(label = contrib), position = position_dodge(width = .9), hjust = -.25, size = 3.5, family = "Gill Sans" ) + coord_flip() + scale_fill_manual(values = rev(pal), guide = guide_legend(reverse = TRUE)) + scale_y_continuous(labels = percent_format(accuracy = 1), expand = c(.1, 0)) + theme_minimal() + labs( title = "Funding by Programme Area Under H2020", subtitle = "(MioEUR)") + theme( text = element_text(size = 14, family = "Gill Sans", color = "gray10"), plot.title.position = "plot", legend.position = "top", legend.title = element_blank(), legend.key.size = unit(0.8, "line"), panel.grid.major.y = element_blank(), axis.title.x = element_blank(), axis.title.y = element_blank(), axis.text.y = element_text(margin = margin(0, -25, 0, 0)))
Figure 4 (Original)
Source: Figure 4. Funding under by programme area (CHF m), in relation to total funding
Participation by Sector
EU Contribution to Swiss Institutions in Research and HigherEd
df %>% filter(country_code == "CH") %>% filter(org_type == "Research & Education") %>% get_participation()
Relative Semester Distribution of EU Contribution
pal <- c("#800000", "#767676") ch <- df %>% filter(!is.na(call_deadline_date)) %>% filter(!is.na(org_type)) %>% filter(country_code == "CH") %>% group_by(Country = country, org_type, Semester = call_semester) %>% summarise(contrib = sum(eu_contribution, na.rm = TRUE)) %>% ungroup() %>% mutate(Share = 100 * contrib / sum(contrib)) rest <- df %>% filter(!is.na(call_deadline_date)) %>% filter(!is.na(org_type)) %>% filter(!country_code %in% c("CH")) %>% mutate( call_semester = floor_date(call_deadline_date, "6 months")) %>% group_by(org_type, Semester = call_semester) %>% summarise(contrib = sum(eu_contribution, na.rm = TRUE)) %>% ungroup() %>% mutate( Share = 100 * contrib / sum(contrib), Country = "Remaining Countries") %>% relocate(Country) combined <- ch %>% bind_rows(rest) %>% mutate( Country = factor(Country, levels = c("Switzerland", "Remaining")), org_type = fct_relevel(org_type, "Others (Excl. R&Ed)", after = Inf) ) combined %>% ggplot(aes(x = Semester, y = Share, fill = Country)) + geom_bar( stat = "identity", width = 120, position = position_dodge(width = 128)) + labs( title = "Time Distribution of EU Contribution by Institution Sector", subtitle = glue( "<span style='color:{pal[1]};'>**Switzerland**</span> ", "vs <span style='color:{pal[2]};weight: bold;'>", "**Remaining Countries**</span>" ), x = "Call Semester", y = "%" ) + scale_fill_manual(values = pal, guide = "none") + facet_wrap(org_type ~ ., ncol = 1) + theme_minimal() + theme( plot.title.position = "plot", plot.subtitle = element_markdown(), text = element_text( size = 14, family = "Gill Sans", color = "gray10" ) )
Country Participation Profiles {.tabset .tabset-fade .tabset-pills}
Excellent Science/Research and HigherEd
pal <- c( rep("#767676", ch_rank - 1), "#800000", rep("#767676", 15 - ch_rank)) ## share to Pillar I contribution_share_pillar <- df %>% filter(!is.na(pillar)) %>% semi_join(top_participants %>% select(country = Country) %>% head(15), by = "country" ) %>% group_by( Country = country, Pillar = pillar ) %>% summarise(`Contribution` = sum(eu_contribution)) %>% mutate(share_pillar = 100 * prop.table(Contribution)) %>% filter(Pillar == "I") %>% select(-Pillar, -Contribution) ## share to Resesearch and HigherEd contribution_share_reshed <- df %>% filter(!is.na(pillar)) %>% semi_join(top_participants %>% select(country = Country) %>% head(15), by = "country" ) %>% group_by( Country = country, Type = org_type ) %>% summarise(`Contribution` = sum(eu_contribution)) %>% mutate(share_reshed = 100 * prop.table(Contribution)) %>% filter(Type == "Research & Education") %>% select(-Type, -Contribution) top_participants %>% inner_join(contribution_share_reshed, by = c("Country")) %>% inner_join(contribution_share_pillar, by = c("Country")) %>% mutate( Country = fct_rev(fct_inorder(Country)), contrib_country = contrib_country / 1000000 ) %>% ggplot( aes( x = share_pillar, y = share_reshed, label = Country, col = Country, size = contrib_country)) + geom_point(fill = NA) + geom_text_repel( size = 5, show.legend = FALSE, box.padding = .75, family = "Gill Sans") + guides(size = guide_legend( title = "Total EU Contribution (MioEUR) :", override.aes = list(fill = "gray45", col = "gray45", shape = 21))) + labs( x = glue("Contributions to Pillar I: ", "Excellent Science\n", "(% of the total contribution to the country)"), y = glue("Contribution to Institutions in Research and HigherEd\n", "(% of the total contribution to the country)")) + scale_color_manual(values = rev(pal), guide = "none") + theme_minimal() + theme( text = element_text(size = 15, family = "Gill Sans", color = "gray10"), plot.title.position = "plot", legend.position = "top")
Industrial Leadership/Private Sector
pal <- c( rep("#767676", ch_rank - 1), "#800000", rep("#767676", 15 - ch_rank)) ## share to Pillar II contribution_share_pillar <- df %>% filter(!is.na(pillar)) %>% semi_join(top_participants %>% select(country = Country) %>% head(15), by = "country" ) %>% group_by( Country = country, Pillar = pillar ) %>% summarise(`Contribution` = sum(eu_contribution)) %>% mutate(share_pillar = 100 * prop.table(Contribution)) %>% filter(Pillar == "II") %>% select(-Pillar, -Contribution) ## share to Resesearch and HigherEd contribution_share_prc <- df %>% filter(!is.na(pillar)) %>% semi_join(top_participants %>% select(country = Country) %>% head(15), by = "country" ) %>% group_by( Country = country, Type = legal_entity_type ) %>% summarise(`Contribution` = sum(eu_contribution)) %>% mutate(share_reshed = 100 * prop.table(Contribution)) %>% filter(Type == "PRC") %>% select(-Type, -Contribution) top_participants %>% inner_join(contribution_share_prc, by = c("Country")) %>% inner_join(contribution_share_pillar, by = c("Country")) %>% mutate( Country = fct_rev(fct_inorder(Country)), contrib_country = contrib_country / 1000000 ) %>% ggplot( aes( x = share_pillar, y = share_reshed, label = Country, col = Country, size = contrib_country)) + geom_point(fill = NA) + geom_text_repel( size = 5, show.legend = FALSE, box.padding = .75, family = "Gill Sans") + guides(size = guide_legend( title = "Total EU Contribution (MioEUR) :", override.aes = list(fill = "gray45", col = "gray45", shape = 21))) + labs( x = glue("Contributions to Pillar II: ", "Industrial Leadership\n", "(% of the total contribution to the country)"), y = glue("Contribution to Private Companies\n", "(% of the total contribution to the country)")) + scale_color_manual(values = rev(pal), guide = "none") + theme_minimal() + theme( text = element_text(size = 15, family = "Gill Sans", color = "gray10"), plot.title.position = "plot", legend.position = "top")
Annex
Top Recipients
Top 30 in Research and Higher Education
df %>% filter(country_code == "CH") %>% filter(org_type == "Research & Education") %>% group_by(Institution = legal_name) %>% summarise( `Nb Projects` = n_distinct(project_id), `EU Contribution` = sum(eu_contribution, na.rm = TRUE) ) %>% arrange(desc(`EU Contribution`)) %>% mutate(Institution = str_to_title(Institution)) %>% slice_head(n = 30) %>% reactable( columns = list( `Nb Projects` = colDef(sortable = TRUE), `EU Contribution` = colDef( sortable = TRUE, format = colFormat( currency = "EUR", separators = TRUE, digits = 2 ) ) ), highlight = TRUE, searchable = TRUE, sortable = FALSE, showSortable = TRUE, compact = TRUE, minRows = 10 )
Top 30 not in Private Companies
df %>% filter(country_code == "CH") %>% filter(org_type == "Private Companies") %>% group_by(Institution = legal_name) %>% summarise( `Nb Projects` = n_distinct(project_id), `EU Contribution` = sum(eu_contribution, na.rm = TRUE) ) %>% arrange(desc(`EU Contribution`)) %>% mutate(Institution = str_to_title(Institution)) %>% slice_head(n = 30) %>% reactable( columns = list( `Nb Projects` = colDef(sortable = TRUE), `EU Contribution` = colDef( sortable = TRUE, format = colFormat( currency = "EUR", separators = TRUE, digits = 2 ) ) ), highlight = TRUE, searchable = TRUE, sortable = FALSE, showSortable = TRUE, compact = TRUE, minRows = 10 )
Top 30 not in Others (Excl. R&Ed)
df %>% filter(country_code == "CH") %>% filter(org_type == "Others (Excl. R&Ed)") %>% group_by(Institution = legal_name) %>% summarise( `Nb Projects` = n_distinct(project_id), `EU Contribution` = sum(eu_contribution, na.rm = TRUE) ) %>% arrange(desc(`EU Contribution`)) %>% mutate(Institution = str_to_title(Institution)) %>% slice_head(n = 30) %>% reactable( columns = list( `Nb Projects` = colDef(sortable = TRUE), `EU Contribution` = colDef( sortable = TRUE, format = colFormat( currency = "EUR", separators = TRUE, digits = 2 ) ) ), highlight = TRUE, searchable = TRUE, sortable = FALSE, showSortable = TRUE, compact = TRUE, minRows = 10 )
# Differentiate pillars I to III stats_depth_1 <- df %>% filter(!is.na(pillar)) %>% filter(country_code == "CH") %>% filter(!pillar %in% chr(roman(1:3))) %>% mutate(pillar = fct_rev(pillar)) %>% group_by(pillar, pillar_descr) %>% summarise(total_eu_contrib = sum(eu_contribution)) %>% ungroup() %>% # for printing mutate( pillar_descr = ifelse( chr(pillar) %in% chr(roman(4:5)), str_c(pillar, ". ", pillar_descr), chr(pillar) ), thematic_priority_abbr = NA ) %>% # for binding select( pillar = pillar_descr, thematic_priority = thematic_priority_abbr, contrib = total_eu_contrib ) stats_depth_2 <- df %>% filter(!is.na(pillar)) %>% filter(country_code == "CH") %>% filter(pillar %in% chr(roman(1:3))) %>% mutate(pillar = fct_rev(pillar)) %>% group_by(pillar, pillar_descr, thematic_priority_abbr) %>% summarise(total_eu_contrib = sum(eu_contribution)) %>% ungroup() %>% mutate(thematic_priority_abbr = case_when( total_eu_contrib < 500000000 ~ "OTHER", TRUE ~ as.character(thematic_priority_abbr) )) %>% group_by(pillar, pillar_descr, thematic_priority_abbr) %>% summarise(total_eu_contrib = sum(total_eu_contrib)) %>% ungroup() %>% unite("pillar", starts_with("pillar"), sep = ". ") %>% # for binding select(pillar, thematic_priority = thematic_priority_abbr, contrib = total_eu_contrib ) stats_depth_2 %>% bind_rows(stats_depth_1) %>% mutate( thematic_priority = replace_na(thematic_priority, ""), contrib_txt = contrib / 1000000, contrib_txt = format( contrib_txt, big.mark = ",", decimal.mark = ".", trim = TRUE, digits = 2 ), contrib_txt = str_c("M€", contrib_txt) ) %>% write_csv(here("data", "treemap-h2020-ch.csv")) # plot with https://rawgraphs.io
he <- tibble( pillar = c( "Excellent Science", "Excellent Science", "Excellent Science", "Industrial Competitiveness", "Industrial Competitiveness", "Industrial Competitiveness", "Industrial Competitiveness", "Industrial Competitiveness", "Industrial Competitiveness", "Industrial Competitiveness", "Innovative Europe", "Innovative Europe", "Innovative Europe", "Widening ERA", "Widening ERA" ), thematic_priority = c( "ERC", "MSCA", "INFRA", "HEALTH", "CULTURE", "SECURITY", "SPACE", "ENERGY", "FOOD", "JRC", "EIC", "ECOSYSTEMS", "EIT", "SPREAD", "RISYS" ), contrib = c( 16004, 6602, 2406, 8256, 2280, 1596, 15349, 15123, 8952, 1970, 10105, 527, 2965, 2955, 438 ) ) he %>% group_by(pillar) %>% summarise(total_contrib = sum(contrib)) %>% mutate(share_contrib = 100 * prop.table(total_contrib)) write_csv(he, here("data", "treemap-he.csv"))
R Package Documentation
Browse R Packages
We want your feedback!
Note that we can't provide technical support on individual packages. You should contact the package authors for that.
Embedding an R snippet on your website
Add the following code to your website.
For more information on customizing the embed code, read Embedding Snippets.