Nothing
README.md
In rAltmetric: Retrieves altmerics data for any published paper from altmetric.com

rAltmetric
This package provides a way to programmatically retrieve altmetric data from altmetric.com for any publication with the appropriate identifer. The package is really simple to use and only has two major functions: One (altmetrics()) to download metrics and another (altmetric_data()) to extract the data into a data.frame. It also includes generic S3 methods to plot/print metrics for any altmetric object.
Questions, features requests and issues should go here. General comments to karthik.ram@gmail.com.
Installing the package
A stable version is available from CRAN. To install
install.packages('rAltmetric')
Development version
# If you don't already have the devtools library, first run
install.packages('devtools')

# then install the package
library(devtools)
install_github('rAltmetric', 'ropensci')
Quick Tutorial
Obtaining metrics
There was a recent paper by Acuna et al that received a lot of attention on Twitter. What was the impact of that paper?
library(rAltmetric)
acuna <- altmetrics('10.1038/489201a')
> acuna
Altmetrics on: "Future impact: Predicting scientific success" with doi 10.1038/489201a (altmetric_id: 942310) published in Nature.
  provider count
1    Feeds     9
2  Google+     1
3    Cited   174
4   Tweets   157
5 Accounts   167
Data
To obtain the metrics in tabular form for further processing, run any object of class altmetric through altmetric_data() to get data that can easily be written to disk as a spreadsheet.
> altmetric_data(acuna)
                                         title
1 Future impact: Predicting scientific success
              doi   nlmid            altmetric_jid     issns
1 10.1038/489201a 0410462 4f6fa50a3cf058f610003160 0028-0836
  journal altmetric_id schema is_oa cited_by_feeds_count
1  Nature       942310  1.5.4 FALSE                  173
  cited_by_gplus_count cited_by_posts_count
1                  173                  173
  cited_by_tweeters_count cited_by_accounts_count   score
1                     156                     166 184.598
  mendeley connotea citeulike pub sci com doc
1        0        0        11  62  84   6   8
                                                                url
1 http://www.nature.com/nature/journal/v489/n7415/full/489201a.html
    added_on published_on subjects scopus_subjects
1 1347471425   1347404400  science         General
  last_updated readers_count X1 count_all count_journal
1   1348828350            11  1    754555         13972
  count_similar_age_1m count_similar_age_3m
1                22408                56213
  count_similar_age_journal_1m count_similar_age_journal_3m
1                          508                         1035
  rank_all rank_journal rank_similar_age_1m
1   754043        13759               22339
  rank_similar_age_3m rank_similar_age_journal_1m
1               56074                         459
  rank_similar_age_journal_3m pct_all pct_journal
1                         947   99.93       98.48
  pct_similar_age_1m pct_similar_age_3m
1              99.69              99.75
  pct_similar_age_journal_1m pct_similar_age_journal_3m
1                      90.35                      91.50
                                              details_url
1 http://www.altmetric.com/details.php?citation_id=942310
You can save these data into a clean spreadsheet format:
acuna_data <- altmetric_data(acuna)
write.csv(acuna_data, file = 'acuna_altmetrics.csv')
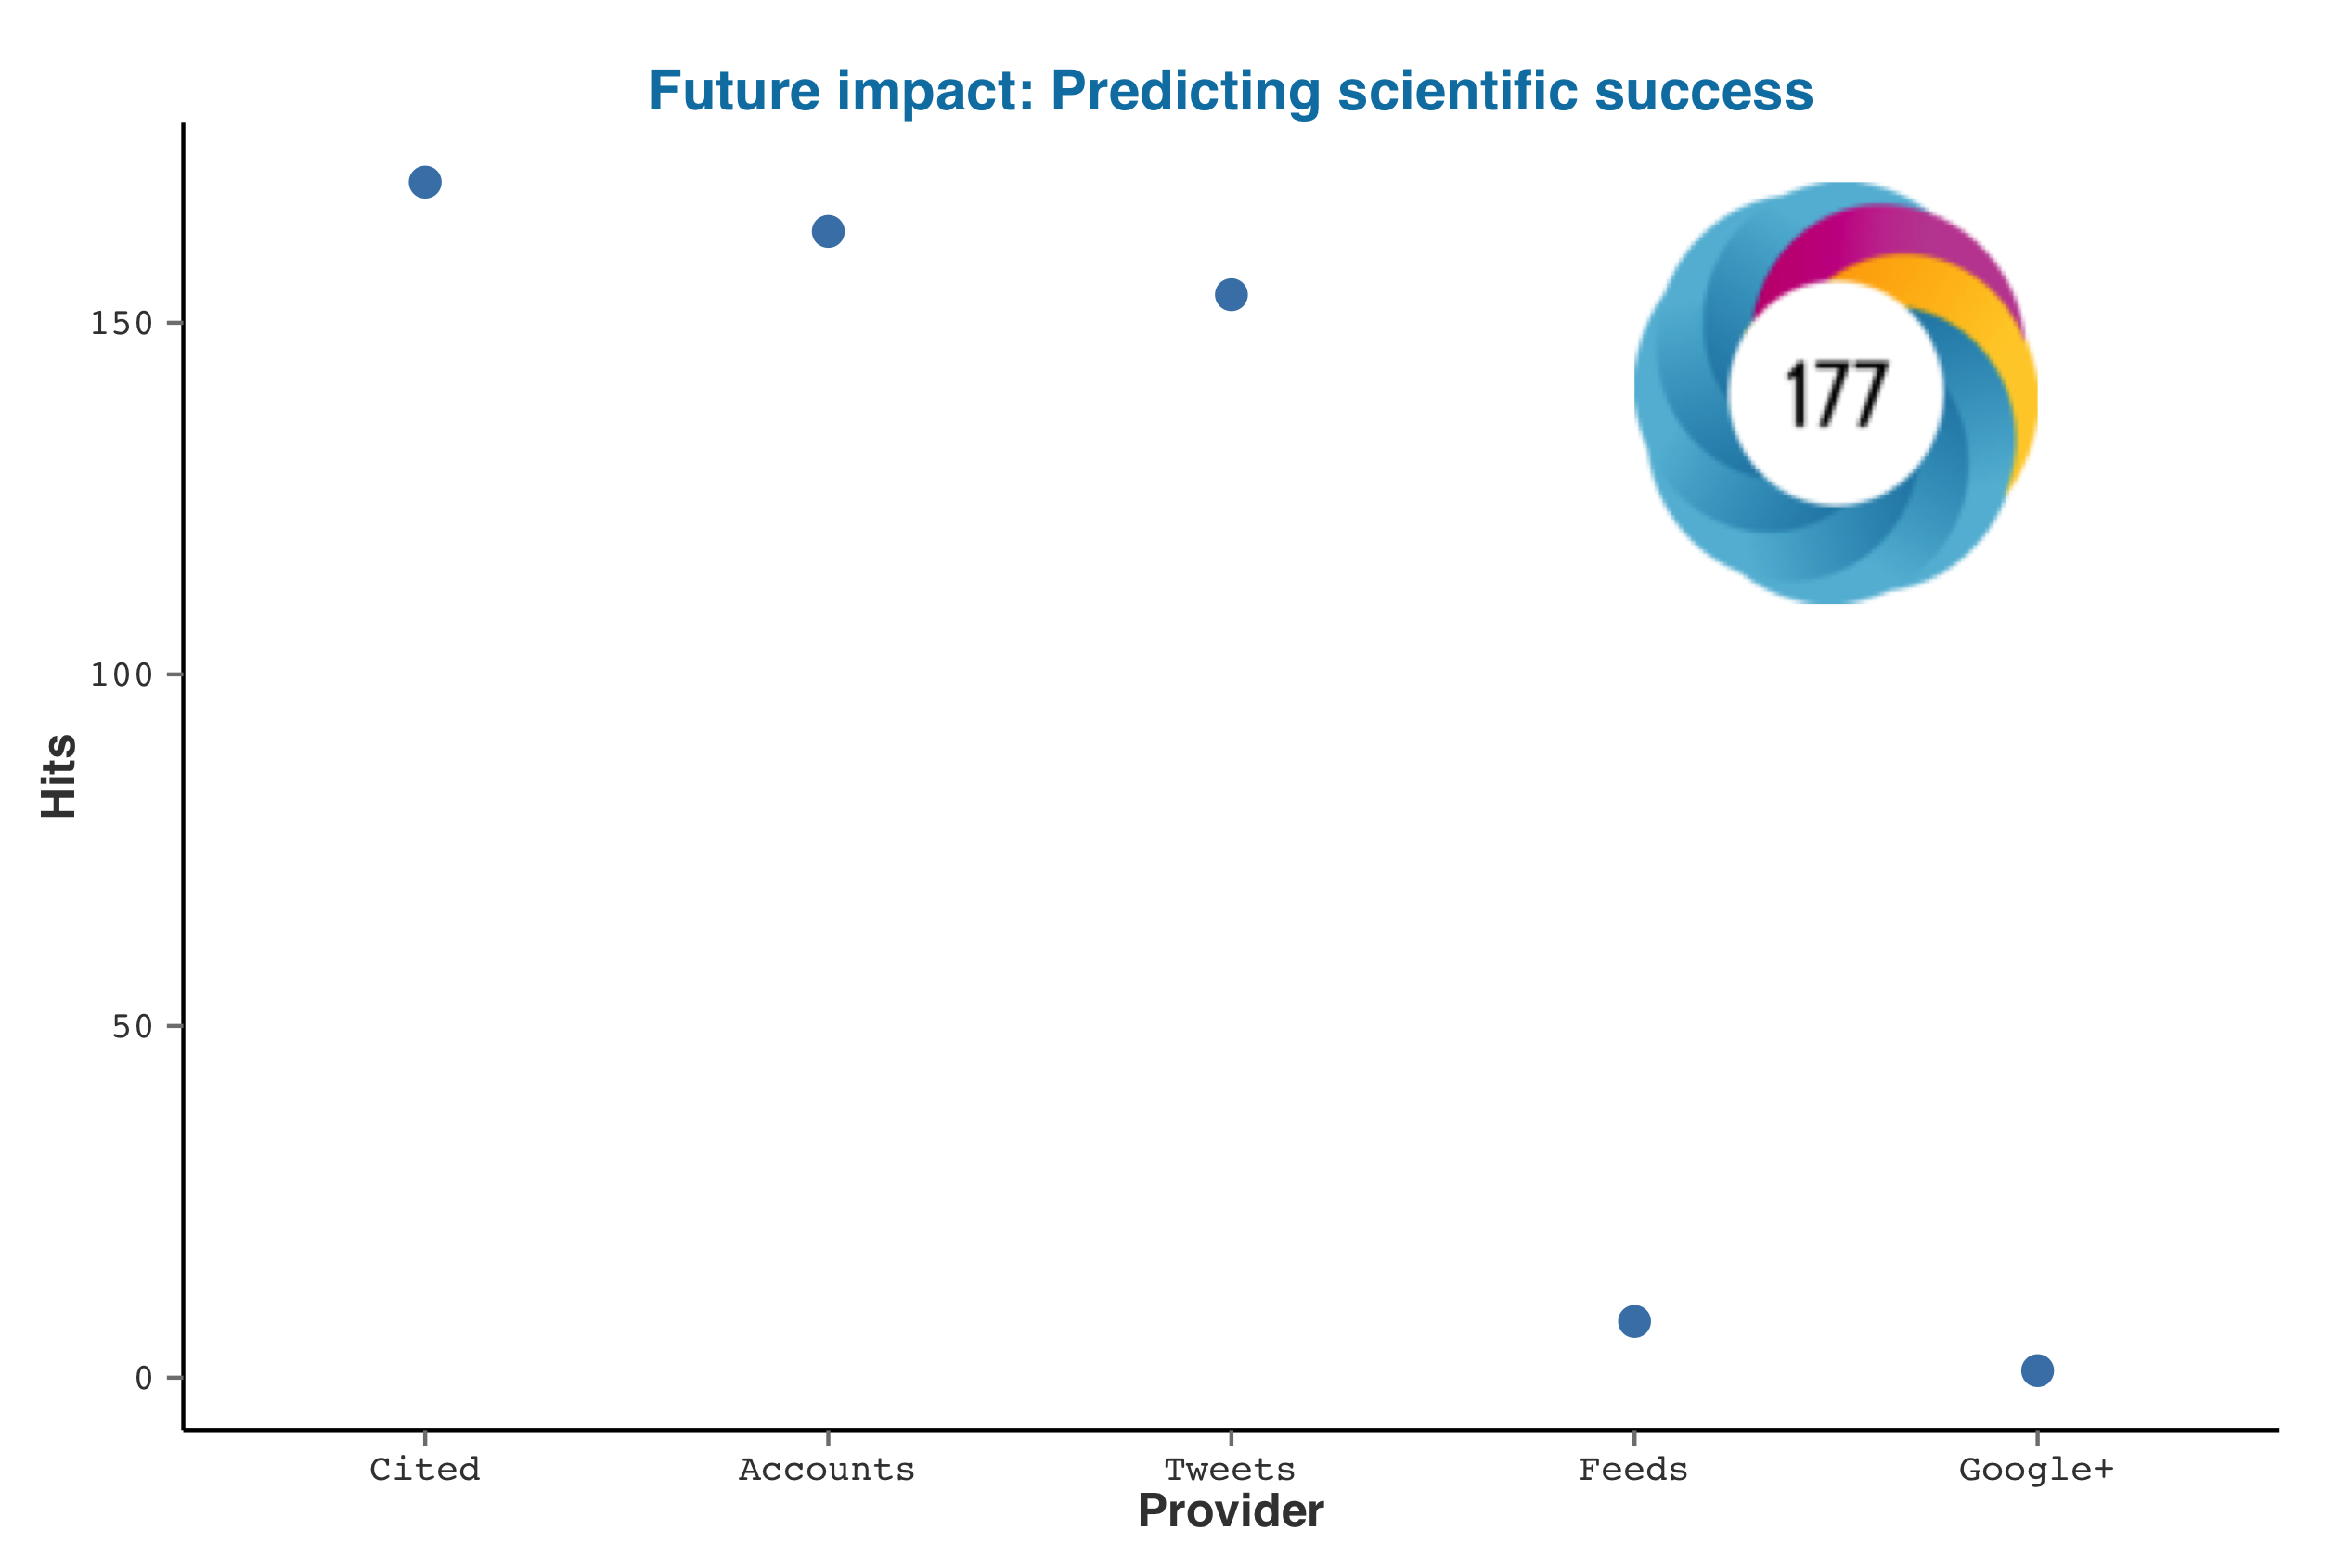
Visualization
For any altmetric object you can quickly plot the stats with a generic plot function. The plot overlays the altmetric badge and the score on the top right corner. If you prefer a customized plot, create your own with the raw data generated from almetric_data()
> plot(acuna)
Gathering metrics for many DOIs
For a real world use-case, one might want to get metrics on multiple publications. If so, just read them from a spreadsheet and llply through them like the example below.
# Be sure to update the path if the example csv is not in your working dir
doi_data <- read.csv('dois.csv', header = TRUE)

> doi_data
                         doi
1        10.1038/nature09210
2    10.1126/science.1187820
3 10.1016/j.tree.2011.01.009
4             10.1086/664183


library(plyr)
# First, let's retrieve the metrics.
raw_metrics <- llply(doi_data$doi, function(x) altmetrics(doi = x), .progress = 'text')
# Now let's pull the data together.
metric_data <- ldply(raw_metrics, altmetric_data)
# Finally we save this to a spreadsheet for further analysis/vizualization.
write.csv(metric_data, file = "metric_data.csv")
Further reading
Try the rAltmetric package in your browser
Any scripts or data that you put into this service are public.
rAltmetric documentation built on May 2, 2019, 4:22 p.m.
R Package Documentation
Browse R Packages
We want your feedback!
Note that we can't provide technical support on individual packages. You should contact the package authors for that.
![]()
rAltmetric
This package provides a way to programmatically retrieve altmetric data from altmetric.com for any publication with the appropriate identifer. The package is really simple to use and only has two major functions: One (altmetrics()) to download metrics and another (altmetric_data()) to extract the data into a data.frame. It also includes generic S3 methods to plot/print metrics for any altmetric object.
Questions, features requests and issues should go here. General comments to karthik.ram@gmail.com.
Installing the package
A stable version is available from CRAN. To install
install.packages('rAltmetric')
Development version
# If you don't already have the devtools library, first run
install.packages('devtools')
# then install the package
library(devtools)
install_github('rAltmetric', 'ropensci')
Quick Tutorial
Obtaining metrics
There was a recent paper by Acuna et al that received a lot of attention on Twitter. What was the impact of that paper?
library(rAltmetric)
acuna <- altmetrics('10.1038/489201a')
> acuna
Altmetrics on: "Future impact: Predicting scientific success" with doi 10.1038/489201a (altmetric_id: 942310) published in Nature.
provider count
1 Feeds 9
2 Google+ 1
3 Cited 174
4 Tweets 157
5 Accounts 167
Data
To obtain the metrics in tabular form for further processing, run any object of class altmetric through altmetric_data() to get data that can easily be written to disk as a spreadsheet.
> altmetric_data(acuna)
title
1 Future impact: Predicting scientific success
doi nlmid altmetric_jid issns
1 10.1038/489201a 0410462 4f6fa50a3cf058f610003160 0028-0836
journal altmetric_id schema is_oa cited_by_feeds_count
1 Nature 942310 1.5.4 FALSE 173
cited_by_gplus_count cited_by_posts_count
1 173 173
cited_by_tweeters_count cited_by_accounts_count score
1 156 166 184.598
mendeley connotea citeulike pub sci com doc
1 0 0 11 62 84 6 8
url
1 http://www.nature.com/nature/journal/v489/n7415/full/489201a.html
added_on published_on subjects scopus_subjects
1 1347471425 1347404400 science General
last_updated readers_count X1 count_all count_journal
1 1348828350 11 1 754555 13972
count_similar_age_1m count_similar_age_3m
1 22408 56213
count_similar_age_journal_1m count_similar_age_journal_3m
1 508 1035
rank_all rank_journal rank_similar_age_1m
1 754043 13759 22339
rank_similar_age_3m rank_similar_age_journal_1m
1 56074 459
rank_similar_age_journal_3m pct_all pct_journal
1 947 99.93 98.48
pct_similar_age_1m pct_similar_age_3m
1 99.69 99.75
pct_similar_age_journal_1m pct_similar_age_journal_3m
1 90.35 91.50
details_url
1 http://www.altmetric.com/details.php?citation_id=942310
You can save these data into a clean spreadsheet format:
acuna_data <- altmetric_data(acuna)
write.csv(acuna_data, file = 'acuna_altmetrics.csv')
Visualization
For any altmetric object you can quickly plot the stats with a generic plot function. The plot overlays the altmetric badge and the score on the top right corner. If you prefer a customized plot, create your own with the raw data generated from almetric_data()
> plot(acuna)
Gathering metrics for many DOIs
For a real world use-case, one might want to get metrics on multiple publications. If so, just read them from a spreadsheet and llply through them like the example below.
# Be sure to update the path if the example csv is not in your working dir
doi_data <- read.csv('dois.csv', header = TRUE)
> doi_data
doi
1 10.1038/nature09210
2 10.1126/science.1187820
3 10.1016/j.tree.2011.01.009
4 10.1086/664183
library(plyr)
# First, let's retrieve the metrics.
raw_metrics <- llply(doi_data$doi, function(x) altmetrics(doi = x), .progress = 'text')
# Now let's pull the data together.
metric_data <- ldply(raw_metrics, altmetric_data)
# Finally we save this to a spreadsheet for further analysis/vizualization.
write.csv(metric_data, file = "metric_data.csv")
Further reading
Try the rAltmetric package in your browser
Any scripts or data that you put into this service are public.
R Package Documentation
Browse R Packages
We want your feedback!
Note that we can't provide technical support on individual packages. You should contact the package authors for that.
Embedding an R snippet on your website
Add the following code to your website.
For more information on customizing the embed code, read Embedding Snippets.