Nothing
README.md
In BoutrosLab.plotting.general: Functions to Create Publication-Quality Plots
BoutrosLab.plotting.general
- Description
- Included plots
- Installation
- Function reference
- Resources
- Getting help
- Contributors
- Citation information
- License
Description
Contains several plotting functions such as barplots, scatterplots, heatmaps, as well as functions to combine plots and assist in the creation of these plots.
These functions will give users great ease of use and customization options in broad use for biomedical applications, as well as general purpose plotting.
Each of the functions also provides valid default settings to make plotting data more efficient and producing high quality plots with standard colour schemes simpler.
All functions within this package are capable of producing plots that are of the quality to be presented in scientific publications and journals.
P'ng et al.; BPG: Seamless, automated and interactive visualization of scientific data; BMC Bioinformatics 2019.
Included plots
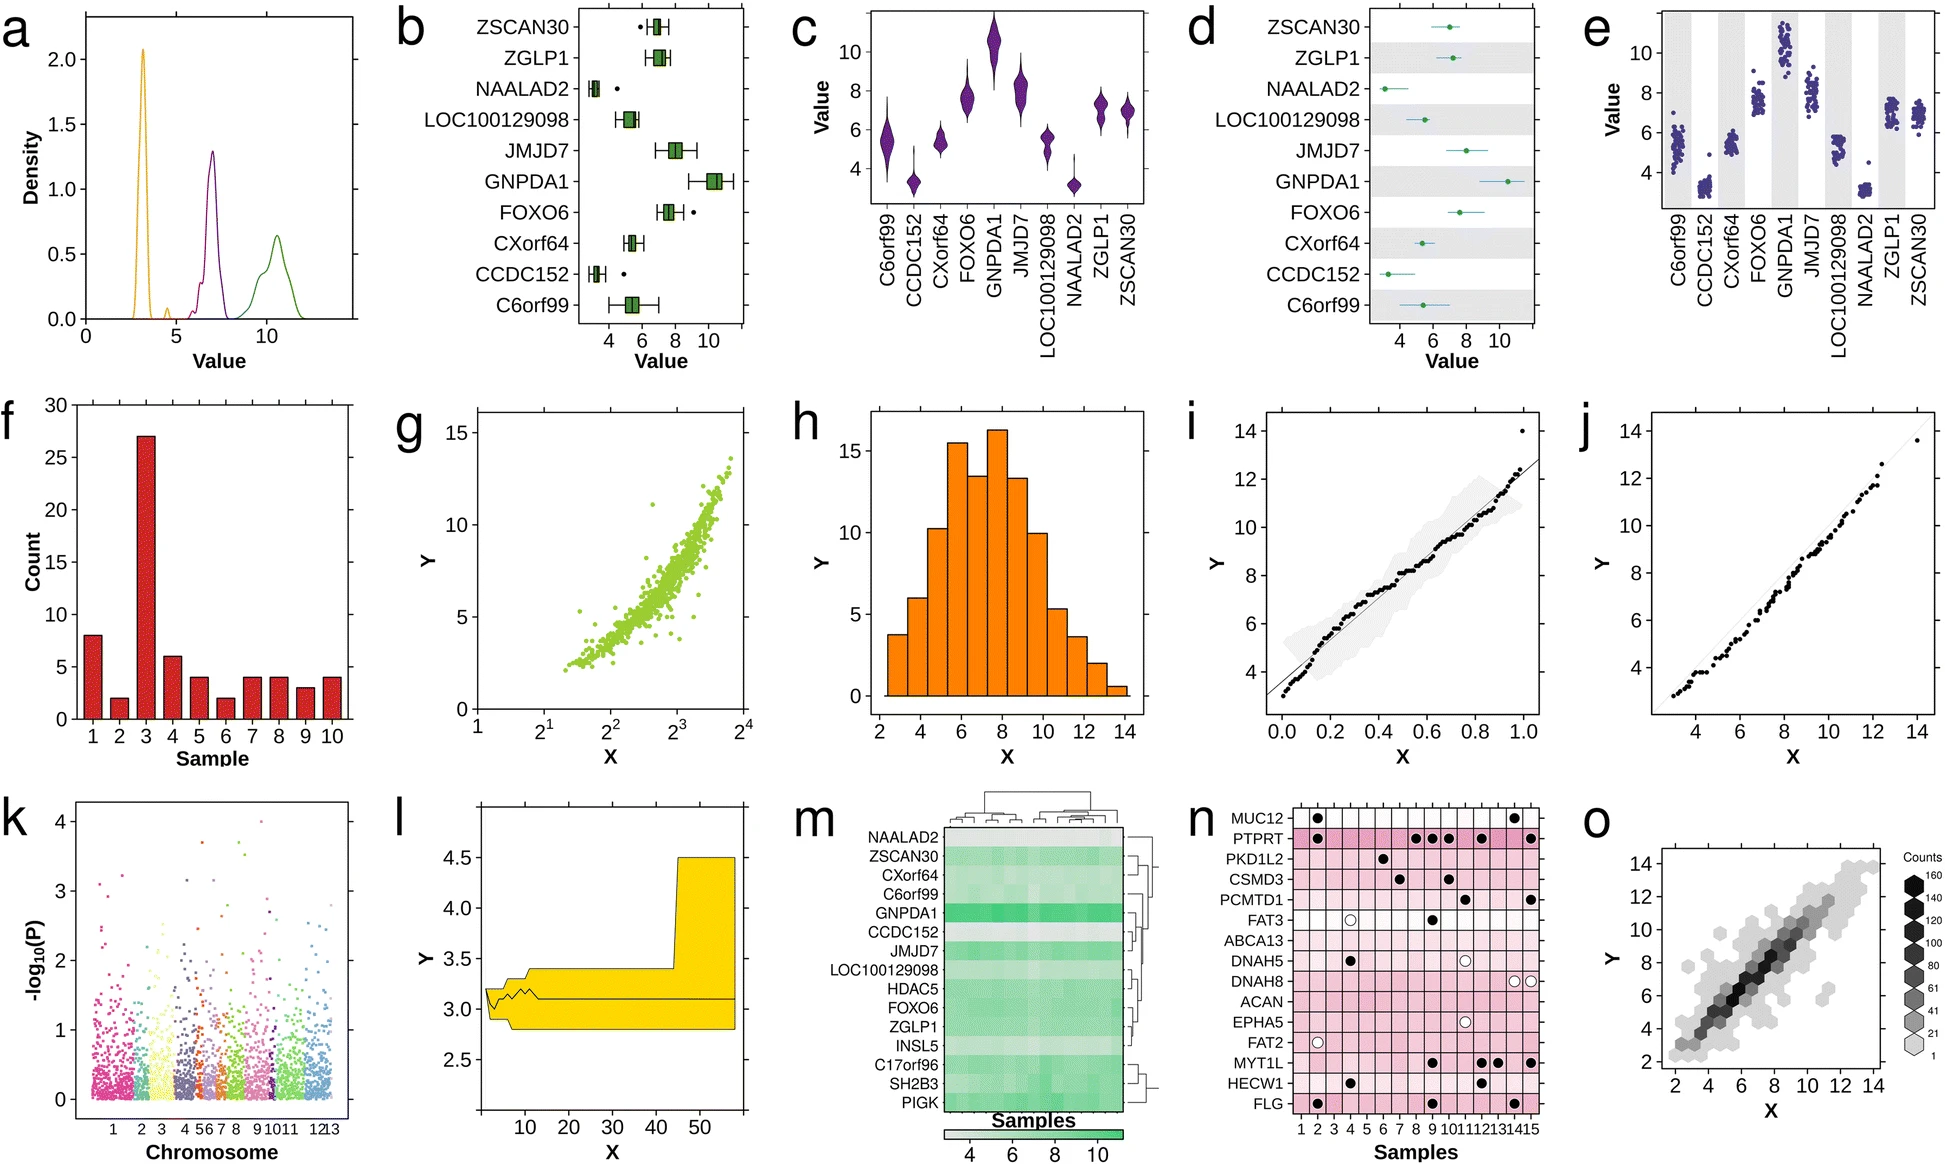
Available chart-types. The basic chart-types available in BPG: a density plot, b boxplot, c violin plot, d segplot, e strip plot, f barplot, g scatterplot, h histogram, i qqplot fit, j qqplot comparison, k Manhattan plot, l polygon plot, m heatmap, n dotmap and o hexbinplot.
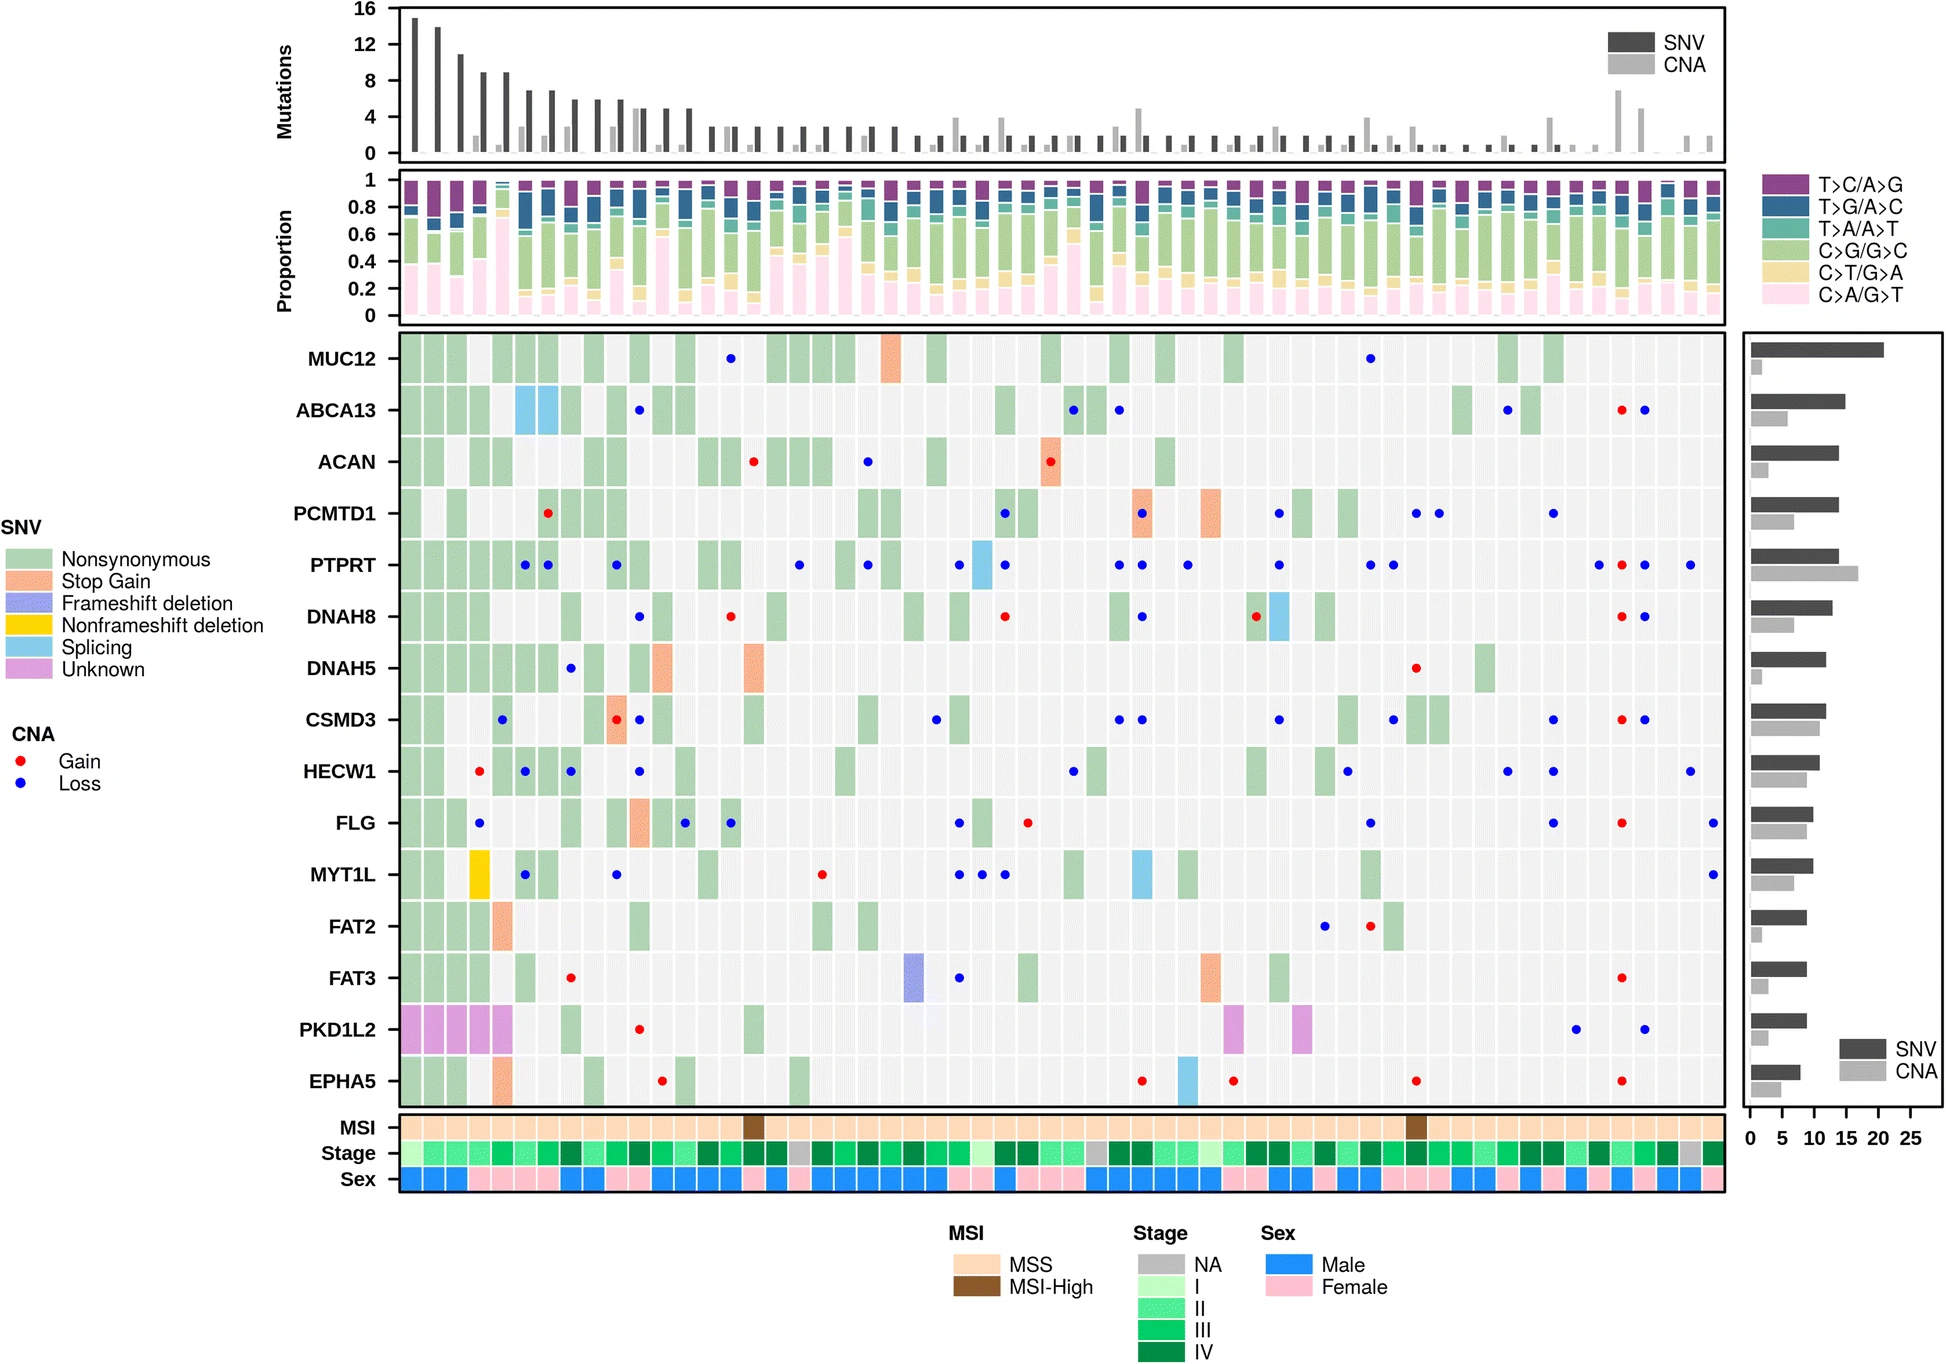
Multiplot example. BPG's create.multiplot function is able to combine multiple chart-types together into a single figure as shown above.
Note: Both create.multipanelplot and create.multiplot are currently supported, however create.multipanelplot is preferable to create.multiplot. In the medium-term create.multiplot will be deprecated.
Installation
To install the latest public release of BoutrosLab.plotting.general from CRAN:
install.packages("Boutros.plotting.general")
Or to install the latest development version from GitHub:
# install.packages("devtools")

devtools::install_github("uclahs-cds/package-BoutrosLab-plotting-general")
Function reference
For further details on usage, parameters or to see an example of a specific function, see function links below.
| Functions | Description |
|-----------|---------|
|auto.axis()|Create ideal labels and values for a given dataset (detects log scales)|
|colour.gradient()|Creates a colour gradient|
|covariates.grob()|Create one or more covariate bars|
|create.barplot()|Make a barplot|
|create.boxplot()|Make a boxplot|
|create.colourkey()|Create Colourkey|
|create.dendrogram()|Generate a dendrogram|
|create.densityplot()|Make a density plot|
|create.dotmap()|Make a dotmap with coloured background|
|create.gif()|Make a gif|
create.heatmap()|Make a heatmap|
|create.hexbinplot()|Make a hexagonally binned plot|
|create.histogram()|Make a histogram|
|create.lollipopplot()|Make a lollipopplot|
|create.manhattanplot()|Make a Manhattan plot|
|create.multipanelplot()|Joins plots together|
|create.multiplot()|Joins plots together|
|create.polygonplot()|Make a polygonplot|
|create.qqplot.comparison()|Make a quantile-quantile plot of two samples|
|create.qqplot.fit()|Make a quantile-quantile plot of a sample|
|create.qqplot.fit.confidence.interval()|Create the confidence bands for a one-sample qq plot|
|create.scatterplot()|Make a scatterplot|
|create.segplot()|Make a segplot|
|create.stripplot()|Make a strip-plot|
|create.violinplot()|Make a violin plot|
|critical.value.ks.test()|Critical Value for Kolmogorov-Smirnov Test|
|default.colours()|Provides default colour schemes.|
|display.colours()|Function to display R colors, as well as corresponding R grey colours.|
|display.statistical.result()|Utility function to display statistical result in a plot|
|dist()|Distance Matrix Computation|
|force.colour.scheme()|Based on predefined colour schemes, returns a vector of corresponding colours.|
|generate.at.final()|Generates alternative default tick mark locations for create.densityplot() and create.|scatterplot()
|get.corr.key()|Correlation Key|
|get.correlation.p.and.corr()|Calculate a correlation and its statistical significance|
|get.defaults()|Get operating system specific default properties|
|get.line.breaks()|Get line breaks|
|legend.grob()|Generate a legend grob|
|panel.BL.bwplot|A lattice::panel.bwplot replacement that fixes colouring issues|
|pcawg.colours()|Return standard PCAWG colour palettes.|
|scientific.notation()|Use scientific notation in plots|
|show.available.palettes()|Display the available colour palettes|
|thousands.split()|Divide strings into groups of thousands|
|write.metadata()|Writes Metadata|
|write.plot()|Simplifies plotting by standardizing and centralizing all output-handling|
Included datasets
| Dataset | Description |
|-----------|---------|
|CNA|Copy number aberration (CNA) data from colon cancer patients|
|SNV|Single nucleotide variant (SNV) data from colon cancer patients|
|microarray|Microarray dataset of colon cancer patients|
|patient|Dataset describing qualities of 58 colon cancer patients|
Resources
Available resources on BPG usage can be found at the package CRAN page, reference manual, or vignette.
Getting help
Looking for guidance or support with Boutros.plotting.general? Check out our Discussions page.
Submit bugs, suggest new features or see current works at our Issues page.
Pull requests are also open for discussion.
Contributors
For lists of contributors please visit here and here at GitHub
Citation information
To cite package BoutrosLab.plotting.general in publications use:
P’ng, C., Green, J., Chong, L.C. et al. BPG: Seamless, automated and interactive visualization of scientific data. BMC Bioinformatics 20, 42 (2019). https://doi.org/10.1186/s12859-019-2610-2
A BibTeX entry for LaTeX users is
  @Article{,
    title = {BPG: Seamless, automated and interactive visualization of scientific data},
    journal = {BMC Bioinformatics},
    doi = {10.1186/s12859-019-2610-2},
    url = {https://doi.org/10.1186/s12859-019-2610-2},
    volume = {20},
    number = {42},
    year = {2019},
    month = {January},
    day = {21},
    issn = {1471-2105},
    author = {Christine P'ng and Jeffrey Green and Lauren C. Chong and Daryl Waggott and Stephenie D. Prokopec and Mehrdad Shamsi and Francis Nguyen and Denise Y. F. Mak and Felix Lam and Marco A. Albuquerque and Ying Wu and Esther H. Jung and Maud H. W. Starmans and Michelle A. Chan-Seng-Yue and Cindy Q. Yao and Bianca Liang and Emilie Lalonde and Syed Haider and Nicole A. Simone and Dorota Sendorek and Kenneth C. Chu and Nathalie C. Moon and Natalie S. Fox and Michal R. Grzadkowski and Nicholas J. Harding and Clement Fung and Amanda R. Murdoch and Kathleen E. Houlahan and Jianxin Wang and David R. Garcia and Richard de Borja and Ren X. Sun and Xihui Lin and Gregory M. Chen and Aileen Lu and Yu-Jia Shiah and Amin Zia and Ryan Kearns and Paul C. Boutros},
  }
License
Authors: Christine P’ng, Jeffrey Green, Lauren C. Chong, Daryl Waggott, Stephenie D. Prokopec, Mehrdad Shamsi, Francis Nguyen, Denise Y. F. Mak, Felix Lam, Marco A. Albuquerque, Ying Wu, Esther H. Jung, Maud H. W. Starmans, Michelle A. Chan-Seng-Yue, Cindy Q. Yao, Bianca Liang, Emilie Lalonde, Syed Haider, Nicole A. Simone, Dorota Sendorek, Kenneth C. Chu, Nathalie C. Moon, Natalie S. Fox, Michal R. Grzadkowski, Nicholas J. Harding, Clement Fung, Amanda R. Murdoch, Kathleen E. Houlahan, Jianxin Wang, David R. Garcia, Richard de Borja, Ren X. Sun, Xihui Lin, Gregory M. Chen, Aileen Lu, Yu-Jia Shiah, Amin Zia, Ryan Kearns, Stefan Eng, Dan Knight, Julie Livingstone, Chase Bakkeby, Rupert Hugh-White, Adriana Salcedo, Takafumi Yamaguchi, Mohammed Faizal Eeman Mootor, Chenghao Zhu, Caden Bugh & Paul C. Boutros (PBoutros@mednet.ucla.edu)
BoutrosLab.plotting.general is licensed under the GNU General Public License version 2. See the file LICENSE.md for the terms of the GNU GPL license.
BoutrosLab.plotting.general is a software package for generating publication-quality, customizable plots.
Copyright (C) 2014-2018 Ontario Institute for Cancer Research and 2018-2023 University of California Los Angeles ("Boutros Lab") All rights reserved.
This program is free software; you can redistribute it and/or modify it under the terms of the GNU General Public License as published by the Free Software Foundation; either version 2 of the License, or (at your option) any later version.
This program is distributed in the hope that it will be useful, but WITHOUT ANY WARRANTY; without even the implied warranty of MERCHANTABILITY or FITNESS FOR A PARTICULAR PURPOSE. See the GNU General Public License for more details.
Try the BoutrosLab.plotting.general package in your browser
Any scripts or data that you put into this service are public.
BoutrosLab.plotting.general documentation built on Nov. 2, 2023, 6:01 p.m.
R Package Documentation
Browse R Packages
We want your feedback!
Note that we can't provide technical support on individual packages. You should contact the package authors for that.
BoutrosLab.plotting.general
- Description
- Included plots
- Installation
- Function reference
- Resources
- Getting help
- Contributors
- Citation information
- License
Description
Contains several plotting functions such as barplots, scatterplots, heatmaps, as well as functions to combine plots and assist in the creation of these plots. These functions will give users great ease of use and customization options in broad use for biomedical applications, as well as general purpose plotting. Each of the functions also provides valid default settings to make plotting data more efficient and producing high quality plots with standard colour schemes simpler. All functions within this package are capable of producing plots that are of the quality to be presented in scientific publications and journals. P'ng et al.; BPG: Seamless, automated and interactive visualization of scientific data; BMC Bioinformatics 2019.
Included plots
Available chart-types. The basic chart-types available in BPG: a density plot, b boxplot, c violin plot, d segplot, e strip plot, f barplot, g scatterplot, h histogram, i qqplot fit, j qqplot comparison, k Manhattan plot, l polygon plot, m heatmap, n dotmap and o hexbinplot.
Multiplot example. BPG's create.multiplot function is able to combine multiple chart-types together into a single figure as shown above.
Note: Both
create.multipanelplotandcreate.multiplotare currently supported, howevercreate.multipanelplotis preferable tocreate.multiplot. In the medium-termcreate.multiplotwill be deprecated.
Installation
To install the latest public release of BoutrosLab.plotting.general from CRAN:
install.packages("Boutros.plotting.general")
Or to install the latest development version from GitHub:
# install.packages("devtools")
devtools::install_github("uclahs-cds/package-BoutrosLab-plotting-general")
Function reference
For further details on usage, parameters or to see an example of a specific function, see function links below.
| Functions | Description |
|-----------|---------|
|auto.axis()|Create ideal labels and values for a given dataset (detects log scales)|
|colour.gradient()|Creates a colour gradient|
|covariates.grob()|Create one or more covariate bars|
|create.barplot()|Make a barplot|
|create.boxplot()|Make a boxplot|
|create.colourkey()|Create Colourkey|
|create.dendrogram()|Generate a dendrogram|
|create.densityplot()|Make a density plot|
|create.dotmap()|Make a dotmap with coloured background|
|create.gif()|Make a gif|
create.heatmap()|Make a heatmap|
|create.hexbinplot()|Make a hexagonally binned plot|
|create.histogram()|Make a histogram|
|create.lollipopplot()|Make a lollipopplot|
|create.manhattanplot()|Make a Manhattan plot|
|create.multipanelplot()|Joins plots together|
|create.multiplot()|Joins plots together|
|create.polygonplot()|Make a polygonplot|
|create.qqplot.comparison()|Make a quantile-quantile plot of two samples|
|create.qqplot.fit()|Make a quantile-quantile plot of a sample|
|create.qqplot.fit.confidence.interval()|Create the confidence bands for a one-sample qq plot|
|create.scatterplot()|Make a scatterplot|
|create.segplot()|Make a segplot|
|create.stripplot()|Make a strip-plot|
|create.violinplot()|Make a violin plot|
|critical.value.ks.test()|Critical Value for Kolmogorov-Smirnov Test|
|default.colours()|Provides default colour schemes.|
|display.colours()|Function to display R colors, as well as corresponding R grey colours.|
|display.statistical.result()|Utility function to display statistical result in a plot|
|dist()|Distance Matrix Computation|
|force.colour.scheme()|Based on predefined colour schemes, returns a vector of corresponding colours.|
|generate.at.final()|Generates alternative default tick mark locations for create.densityplot() and create.|scatterplot()
|get.corr.key()|Correlation Key|
|get.correlation.p.and.corr()|Calculate a correlation and its statistical significance|
|get.defaults()|Get operating system specific default properties|
|get.line.breaks()|Get line breaks|
|legend.grob()|Generate a legend grob|
|panel.BL.bwplot|A lattice::panel.bwplot replacement that fixes colouring issues|
|pcawg.colours()|Return standard PCAWG colour palettes.|
|scientific.notation()|Use scientific notation in plots|
|show.available.palettes()|Display the available colour palettes|
|thousands.split()|Divide strings into groups of thousands|
|write.metadata()|Writes Metadata|
|write.plot()|Simplifies plotting by standardizing and centralizing all output-handling|
Included datasets
| Dataset | Description |
|-----------|---------|
|CNA|Copy number aberration (CNA) data from colon cancer patients|
|SNV|Single nucleotide variant (SNV) data from colon cancer patients|
|microarray|Microarray dataset of colon cancer patients|
|patient|Dataset describing qualities of 58 colon cancer patients|
Resources
Available resources on BPG usage can be found at the package CRAN page, reference manual, or vignette.
Getting help
Looking for guidance or support with Boutros.plotting.general? Check out our Discussions page.
Submit bugs, suggest new features or see current works at our Issues page.
Pull requests are also open for discussion.
Contributors
For lists of contributors please visit here and here at GitHub
Citation information
To cite package BoutrosLab.plotting.general in publications use:
P’ng, C., Green, J., Chong, L.C. et al. BPG: Seamless, automated and interactive visualization of scientific data. BMC Bioinformatics 20, 42 (2019). https://doi.org/10.1186/s12859-019-2610-2
A BibTeX entry for LaTeX users is
@Article{,
title = {BPG: Seamless, automated and interactive visualization of scientific data},
journal = {BMC Bioinformatics},
doi = {10.1186/s12859-019-2610-2},
url = {https://doi.org/10.1186/s12859-019-2610-2},
volume = {20},
number = {42},
year = {2019},
month = {January},
day = {21},
issn = {1471-2105},
author = {Christine P'ng and Jeffrey Green and Lauren C. Chong and Daryl Waggott and Stephenie D. Prokopec and Mehrdad Shamsi and Francis Nguyen and Denise Y. F. Mak and Felix Lam and Marco A. Albuquerque and Ying Wu and Esther H. Jung and Maud H. W. Starmans and Michelle A. Chan-Seng-Yue and Cindy Q. Yao and Bianca Liang and Emilie Lalonde and Syed Haider and Nicole A. Simone and Dorota Sendorek and Kenneth C. Chu and Nathalie C. Moon and Natalie S. Fox and Michal R. Grzadkowski and Nicholas J. Harding and Clement Fung and Amanda R. Murdoch and Kathleen E. Houlahan and Jianxin Wang and David R. Garcia and Richard de Borja and Ren X. Sun and Xihui Lin and Gregory M. Chen and Aileen Lu and Yu-Jia Shiah and Amin Zia and Ryan Kearns and Paul C. Boutros},
}
License
Authors: Christine P’ng, Jeffrey Green, Lauren C. Chong, Daryl Waggott, Stephenie D. Prokopec, Mehrdad Shamsi, Francis Nguyen, Denise Y. F. Mak, Felix Lam, Marco A. Albuquerque, Ying Wu, Esther H. Jung, Maud H. W. Starmans, Michelle A. Chan-Seng-Yue, Cindy Q. Yao, Bianca Liang, Emilie Lalonde, Syed Haider, Nicole A. Simone, Dorota Sendorek, Kenneth C. Chu, Nathalie C. Moon, Natalie S. Fox, Michal R. Grzadkowski, Nicholas J. Harding, Clement Fung, Amanda R. Murdoch, Kathleen E. Houlahan, Jianxin Wang, David R. Garcia, Richard de Borja, Ren X. Sun, Xihui Lin, Gregory M. Chen, Aileen Lu, Yu-Jia Shiah, Amin Zia, Ryan Kearns, Stefan Eng, Dan Knight, Julie Livingstone, Chase Bakkeby, Rupert Hugh-White, Adriana Salcedo, Takafumi Yamaguchi, Mohammed Faizal Eeman Mootor, Chenghao Zhu, Caden Bugh & Paul C. Boutros (PBoutros@mednet.ucla.edu)
BoutrosLab.plotting.general is licensed under the GNU General Public License version 2. See the file LICENSE.md for the terms of the GNU GPL license.
BoutrosLab.plotting.general is a software package for generating publication-quality, customizable plots.
Copyright (C) 2014-2018 Ontario Institute for Cancer Research and 2018-2023 University of California Los Angeles ("Boutros Lab") All rights reserved.
This program is free software; you can redistribute it and/or modify it under the terms of the GNU General Public License as published by the Free Software Foundation; either version 2 of the License, or (at your option) any later version.
This program is distributed in the hope that it will be useful, but WITHOUT ANY WARRANTY; without even the implied warranty of MERCHANTABILITY or FITNESS FOR A PARTICULAR PURPOSE. See the GNU General Public License for more details.
Try the BoutrosLab.plotting.general package in your browser
Any scripts or data that you put into this service are public.
R Package Documentation
Browse R Packages
We want your feedback!
Note that we can't provide technical support on individual packages. You should contact the package authors for that.
Embedding an R snippet on your website
Add the following code to your website.
For more information on customizing the embed code, read Embedding Snippets.