Nothing
In choroplethr: Simplify the Creation of Choropleth Maps in R
Mapping US Census Data
choroplethr provides native support for creating choropleths from US Census data. Note that the Census Bureau has many datasets; currently choroplethr only works with data from the American Community Survey (ACS). Below is an overview of Choroplethr's functionality for working with ACS data. To learn more please take the free course Mapping Census Bureau Data in R with Choroplethr.
Choroplethr has three functions for working with ACS data:
?get_acs_data?state_choroplethr_acs ?county_choropleth_acs
Census API Key
To use these functions you must get and install a Census API. It is free and you can get one here. Then type the following from R:
library(acs)
api.key.install('<your census api key>')
Note that the Census API currently only provides ACS data from 2010 onwards.
Navigating ACS Data
Here are some tips for getting started with ACS data:
- Browse the list of questions the ACS asks.
- Learn the difference between the 1, 3 and 5 year estimates.
- Visit data.census.gov to select a table you wish to visualize. You will likely be surprised at just how much data is available. Here are some popular tables to gets you started:
- B01003: total population
- B01002: median age by sex
- B19001: household income in the last 12 months
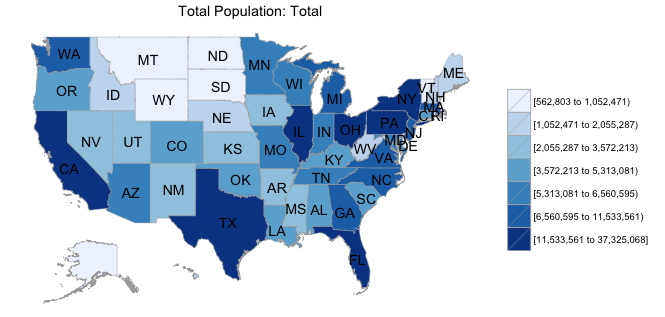
Example
Here is how to view population estimates for each state from the 2012 5-year ACS. Notice that the title is automatically created for you from the name of the table. Note that it is commented out because CRAN's servers do not have a US Census API key installed.
# state_choropleth_acs("B01003", endyear=2012, span=5)
Try the choroplethr package in your browser
Any scripts or data that you put into this service are public.
choroplethr documentation built on July 9, 2023, 5:35 p.m.
R Package Documentation
Browse R Packages
We want your feedback!
Note that we can't provide technical support on individual packages. You should contact the package authors for that.
Mapping US Census Data
choroplethr provides native support for creating choropleths from US Census data. Note that the Census Bureau has many datasets; currently choroplethr only works with data from the American Community Survey (ACS). Below is an overview of Choroplethr's functionality for working with ACS data. To learn more please take the free course Mapping Census Bureau Data in R with Choroplethr.
Choroplethr has three functions for working with ACS data:
?get_acs_data?state_choroplethr_acs?county_choropleth_acs
Census API Key
To use these functions you must get and install a Census API. It is free and you can get one here. Then type the following from R:
library(acs)
api.key.install('<your census api key>')
Note that the Census API currently only provides ACS data from 2010 onwards.
Navigating ACS Data
Here are some tips for getting started with ACS data:
- Browse the list of questions the ACS asks.
- Learn the difference between the 1, 3 and 5 year estimates.
- Visit data.census.gov to select a table you wish to visualize. You will likely be surprised at just how much data is available. Here are some popular tables to gets you started:
- B01003: total population
- B01002: median age by sex
- B19001: household income in the last 12 months
Example
Here is how to view population estimates for each state from the 2012 5-year ACS. Notice that the title is automatically created for you from the name of the table. Note that it is commented out because CRAN's servers do not have a US Census API key installed.
# state_choropleth_acs("B01003", endyear=2012, span=5)
Try the choroplethr package in your browser
Any scripts or data that you put into this service are public.
R Package Documentation
Browse R Packages
We want your feedback!
Note that we can't provide technical support on individual packages. You should contact the package authors for that.
Embedding an R snippet on your website
Add the following code to your website.
For more information on customizing the embed code, read Embedding Snippets.