Nothing
tests/testthat/examples/knitr-examples/041-label-i.md
In parsermd: Formal Parser and Related Tools for R Markdown Documents
My report
data(mtcars)
This example shows how to generate chunk labels dynamically with the brew syntax. It was motivated by the SO question: http://stackoverflow.com/q/12095113/559676
Generate report for each level of cylinder variable
6
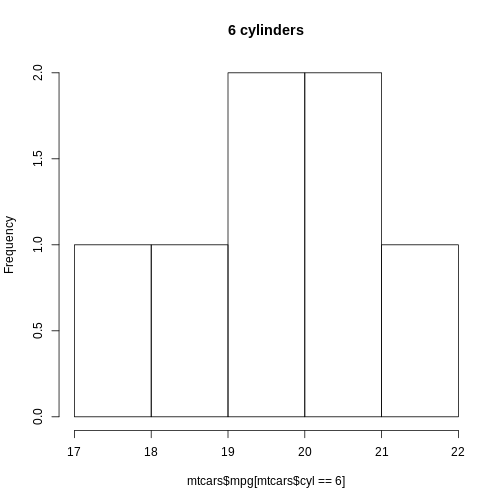
hist(mtcars$mpg[mtcars$cyl == 6], main = paste(6, "cylinders"))
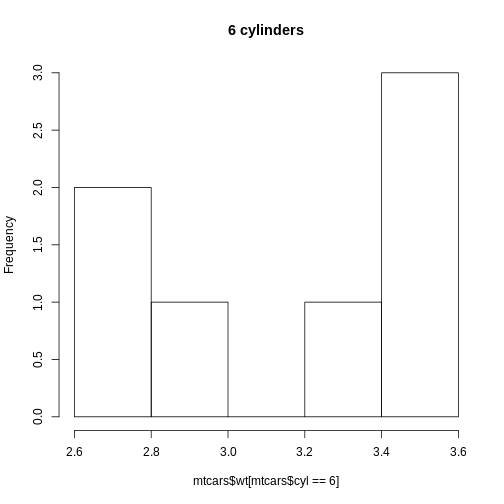
hist(mtcars$wt[mtcars$cyl == 6], main = paste(6, "cylinders"))
4
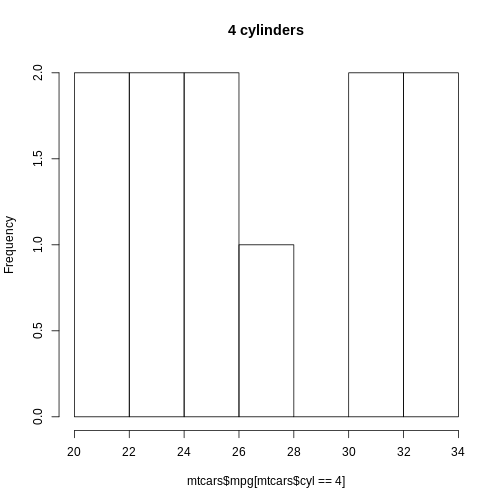
hist(mtcars$mpg[mtcars$cyl == 4], main = paste(4, "cylinders"))
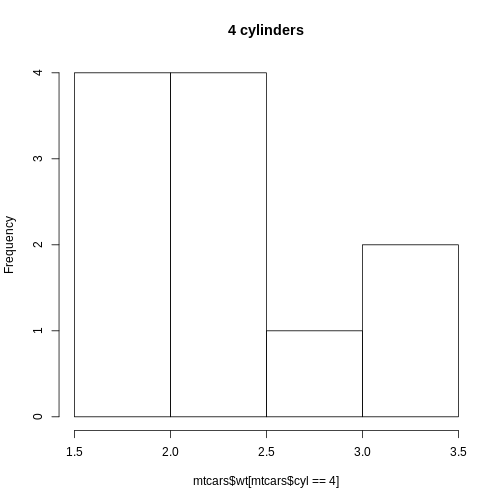
hist(mtcars$wt[mtcars$cyl == 4], main = paste(4, "cylinders"))
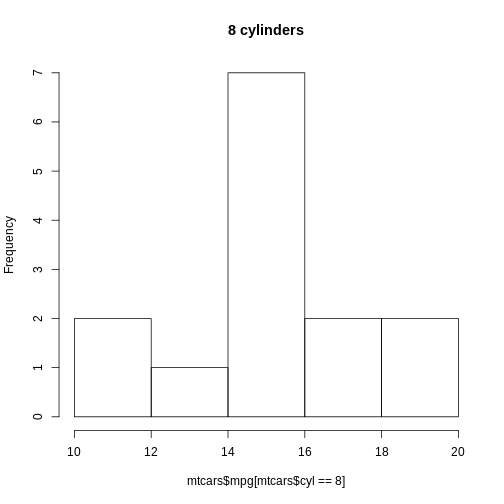
8
hist(mtcars$mpg[mtcars$cyl == 8], main = paste(8, "cylinders"))
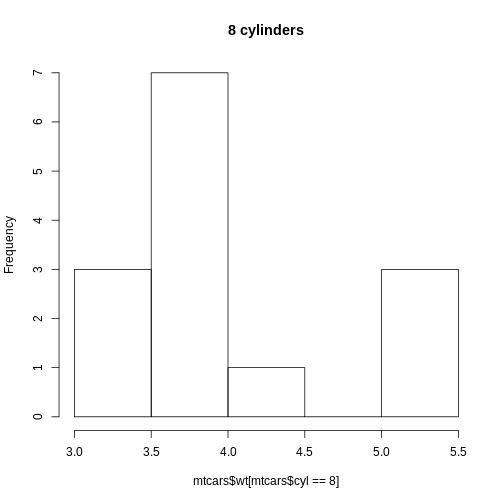
hist(mtcars$wt[mtcars$cyl == 8], main = paste(8, "cylinders"))
Try the parsermd package in your browser
Any scripts or data that you put into this service are public.
parsermd documentation built on Aug. 21, 2025, 5:27 p.m.
R Package Documentation
Browse R Packages
We want your feedback!
Note that we can't provide technical support on individual packages. You should contact the package authors for that.
My report
data(mtcars)
This example shows how to generate chunk labels dynamically with the brew syntax. It was motivated by the SO question: http://stackoverflow.com/q/12095113/559676
Generate report for each level of cylinder variable
6
hist(mtcars$mpg[mtcars$cyl == 6], main = paste(6, "cylinders"))
hist(mtcars$wt[mtcars$cyl == 6], main = paste(6, "cylinders"))
4
hist(mtcars$mpg[mtcars$cyl == 4], main = paste(4, "cylinders"))
hist(mtcars$wt[mtcars$cyl == 4], main = paste(4, "cylinders"))
8
hist(mtcars$mpg[mtcars$cyl == 8], main = paste(8, "cylinders"))
hist(mtcars$wt[mtcars$cyl == 8], main = paste(8, "cylinders"))
Try the parsermd package in your browser
Any scripts or data that you put into this service are public.
R Package Documentation
Browse R Packages
We want your feedback!
Note that we can't provide technical support on individual packages. You should contact the package authors for that.
Embedding an R snippet on your website
Add the following code to your website.
For more information on customizing the embed code, read Embedding Snippets.