tests/testthat/examples/knitr-examples/093-knitr-asy.md
In parsermd: Formal Parser and Related Tools for R Markdown Documents
Asymptote graphics example
Description
The engine runs the code using the asy command line program. The result can be svg, png or pdf. svg renders better within html. For LaTeX pdf/png can be used.
see Asymptote website for installation and documentation.
On OS X, one can simply run:
brew install asymptote
Please have a look at the online gallery to see how much can be done with asymptote.
Example
An example of the asy-engine:
real u = 40;
// just a comment
draw( (0,0) .. (u,u) .. (u,0) -- (0,0) );

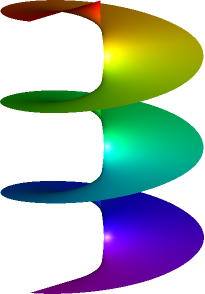
3D example
import graph3;
import palette;

size(200,300,keepAspect=false);
//settings.nothin=true;

currentprojection=orthographic(10,10,30);
currentlight=(10,10,5);
triple f(pair t) {return (exp(t.x)*cos(t.y),exp(t.x)*sin(t.y),t.y);}

surface s=surface(f,(-4,-2pi),(0,4pi),8,16,Spline);
s.colors(palette(s.map(zpart),Rainbow()));
draw(s,render(merge=true));

An example with data from R
In this example, I generate data in R and then use it for plotting in asymptote. In addition I use asymptote to find the intersection between the R path and a line. At that intersection I add a latex label.
x = seq(0, 5, l = 100)
y = sin(x)

# save data to csv file
write.table(data.frame(x, y), file = "asy.csv", col.names = FALSE, row.names = FALSE,
    sep = ",")
import graph;
size(200,150,IgnoreAspect);

// import data from csv file
file in=input("asy.csv").line().csv();
real[][] a=in.dimension(0,0);
a=transpose(a);

// generate a path
path rpath = graph(a[0],a[1]);
path lpath = (1,0)--(5,1);

// find intersection
pair pA=intersectionpoint(rpath,lpath);

// draw all
draw(rpath,red);
draw(lpath,dashed + blue);
dot("$\delta$",pA,NE);
xaxis("$x$",BottomTop,LeftTicks);
yaxis("$y$",LeftRight,RightTicks);

Try the parsermd package in your browser
Any scripts or data that you put into this service are public.
parsermd documentation built on Aug. 21, 2025, 5:27 p.m.
Asymptote graphics example
Description
The engine runs the code using the asy command line program. The result can be svg, png or pdf. svg renders better within html. For LaTeX pdf/png can be used.
see Asymptote website for installation and documentation.
On OS X, one can simply run:
brew install asymptote
Please have a look at the online gallery to see how much can be done with asymptote.
Example
An example of the asy-engine:
real u = 40;
// just a comment
draw( (0,0) .. (u,u) .. (u,0) -- (0,0) );
3D example
import graph3;
import palette;
size(200,300,keepAspect=false);
//settings.nothin=true;
currentprojection=orthographic(10,10,30);
currentlight=(10,10,5);
triple f(pair t) {return (exp(t.x)*cos(t.y),exp(t.x)*sin(t.y),t.y);}
surface s=surface(f,(-4,-2pi),(0,4pi),8,16,Spline);
s.colors(palette(s.map(zpart),Rainbow()));
draw(s,render(merge=true));

An example with data from R
In this example, I generate data in R and then use it for plotting in asymptote. In addition I use asymptote to find the intersection between the R path and a line. At that intersection I add a latex label.
x = seq(0, 5, l = 100)
y = sin(x)
# save data to csv file
write.table(data.frame(x, y), file = "asy.csv", col.names = FALSE, row.names = FALSE,
sep = ",")
import graph;
size(200,150,IgnoreAspect);
// import data from csv file
file in=input("asy.csv").line().csv();
real[][] a=in.dimension(0,0);
a=transpose(a);
// generate a path
path rpath = graph(a[0],a[1]);
path lpath = (1,0)--(5,1);
// find intersection
pair pA=intersectionpoint(rpath,lpath);
// draw all
draw(rpath,red);
draw(lpath,dashed + blue);
dot("$\delta$",pA,NE);
xaxis("$x$",BottomTop,LeftTicks);
yaxis("$y$",LeftRight,RightTicks);
Try the parsermd package in your browser
Any scripts or data that you put into this service are public.
Add the following code to your website.
For more information on customizing the embed code, read Embedding Snippets.
