README.md
In LeiLi-Uchicago/HTOreader: An R package for cell hashing demultiplexing
HTOreader
An R toolkit for cell hashing (HTO) demultiplexing

How to install
make sure you installed these two dependencies:
install.packages("flexmix") install.packages("hash")
then:
if (!require("devtools")) {install.packages("devtools")}
devtools::install_github("WilsonImmunologyLab/HTOreader")
Hnads on Example of Hybrid demultiplexing using real-world data
Please click the following link for a detailed example


Please refer to /docs folder of this repository. We have provided the HTML version and the R markdown file.
Data for this sample under /data folder.
Quick start
The pbmc.hashtag in the following example is a Seurat object. Please load your "HTO" assay using the Seurat package (More details in our example).
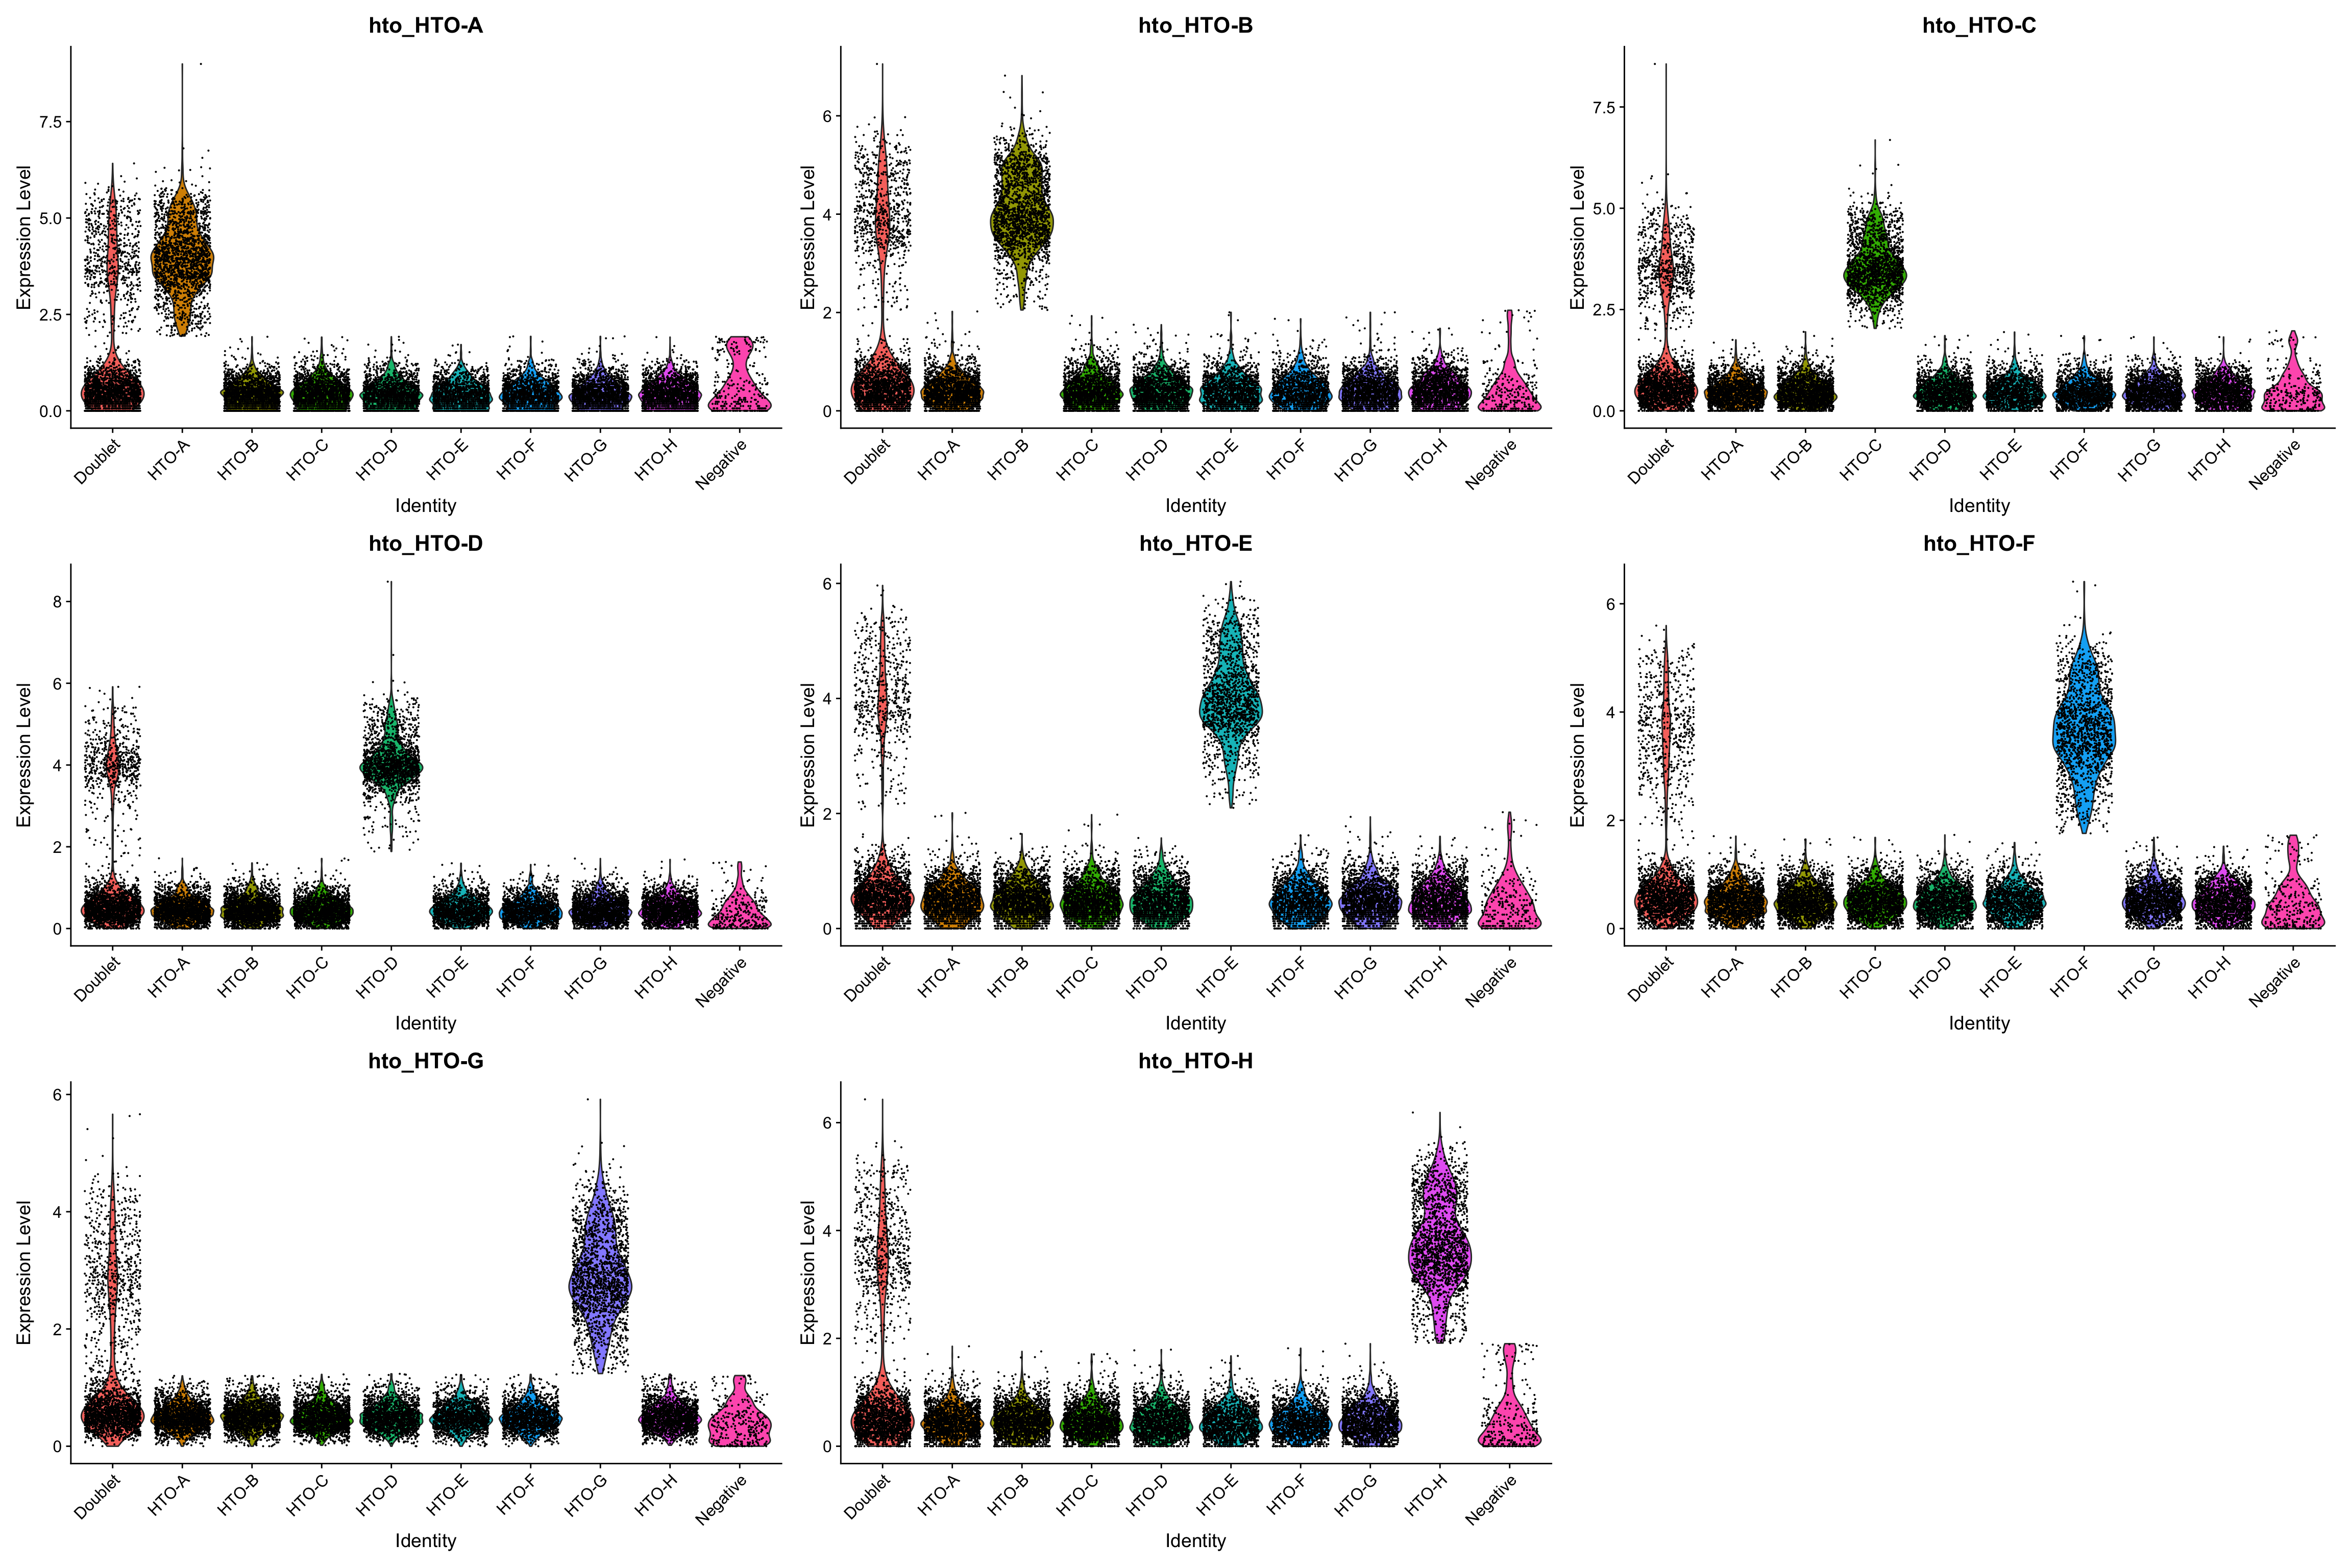
There are two main functions, HTOClassification for Hashtag demultiplexing, PlotHTO for plotting distributions of hashtags
pbmc.hashtag <- HTOClassification(pbmc.hashtag, assay = 'HTO', method = 'CLR')
VlnPlot(pbmc.hashtag,features = rownames(pbmc.hashtag@assays[["HTO"]]@data), group.by = 'HTOid')
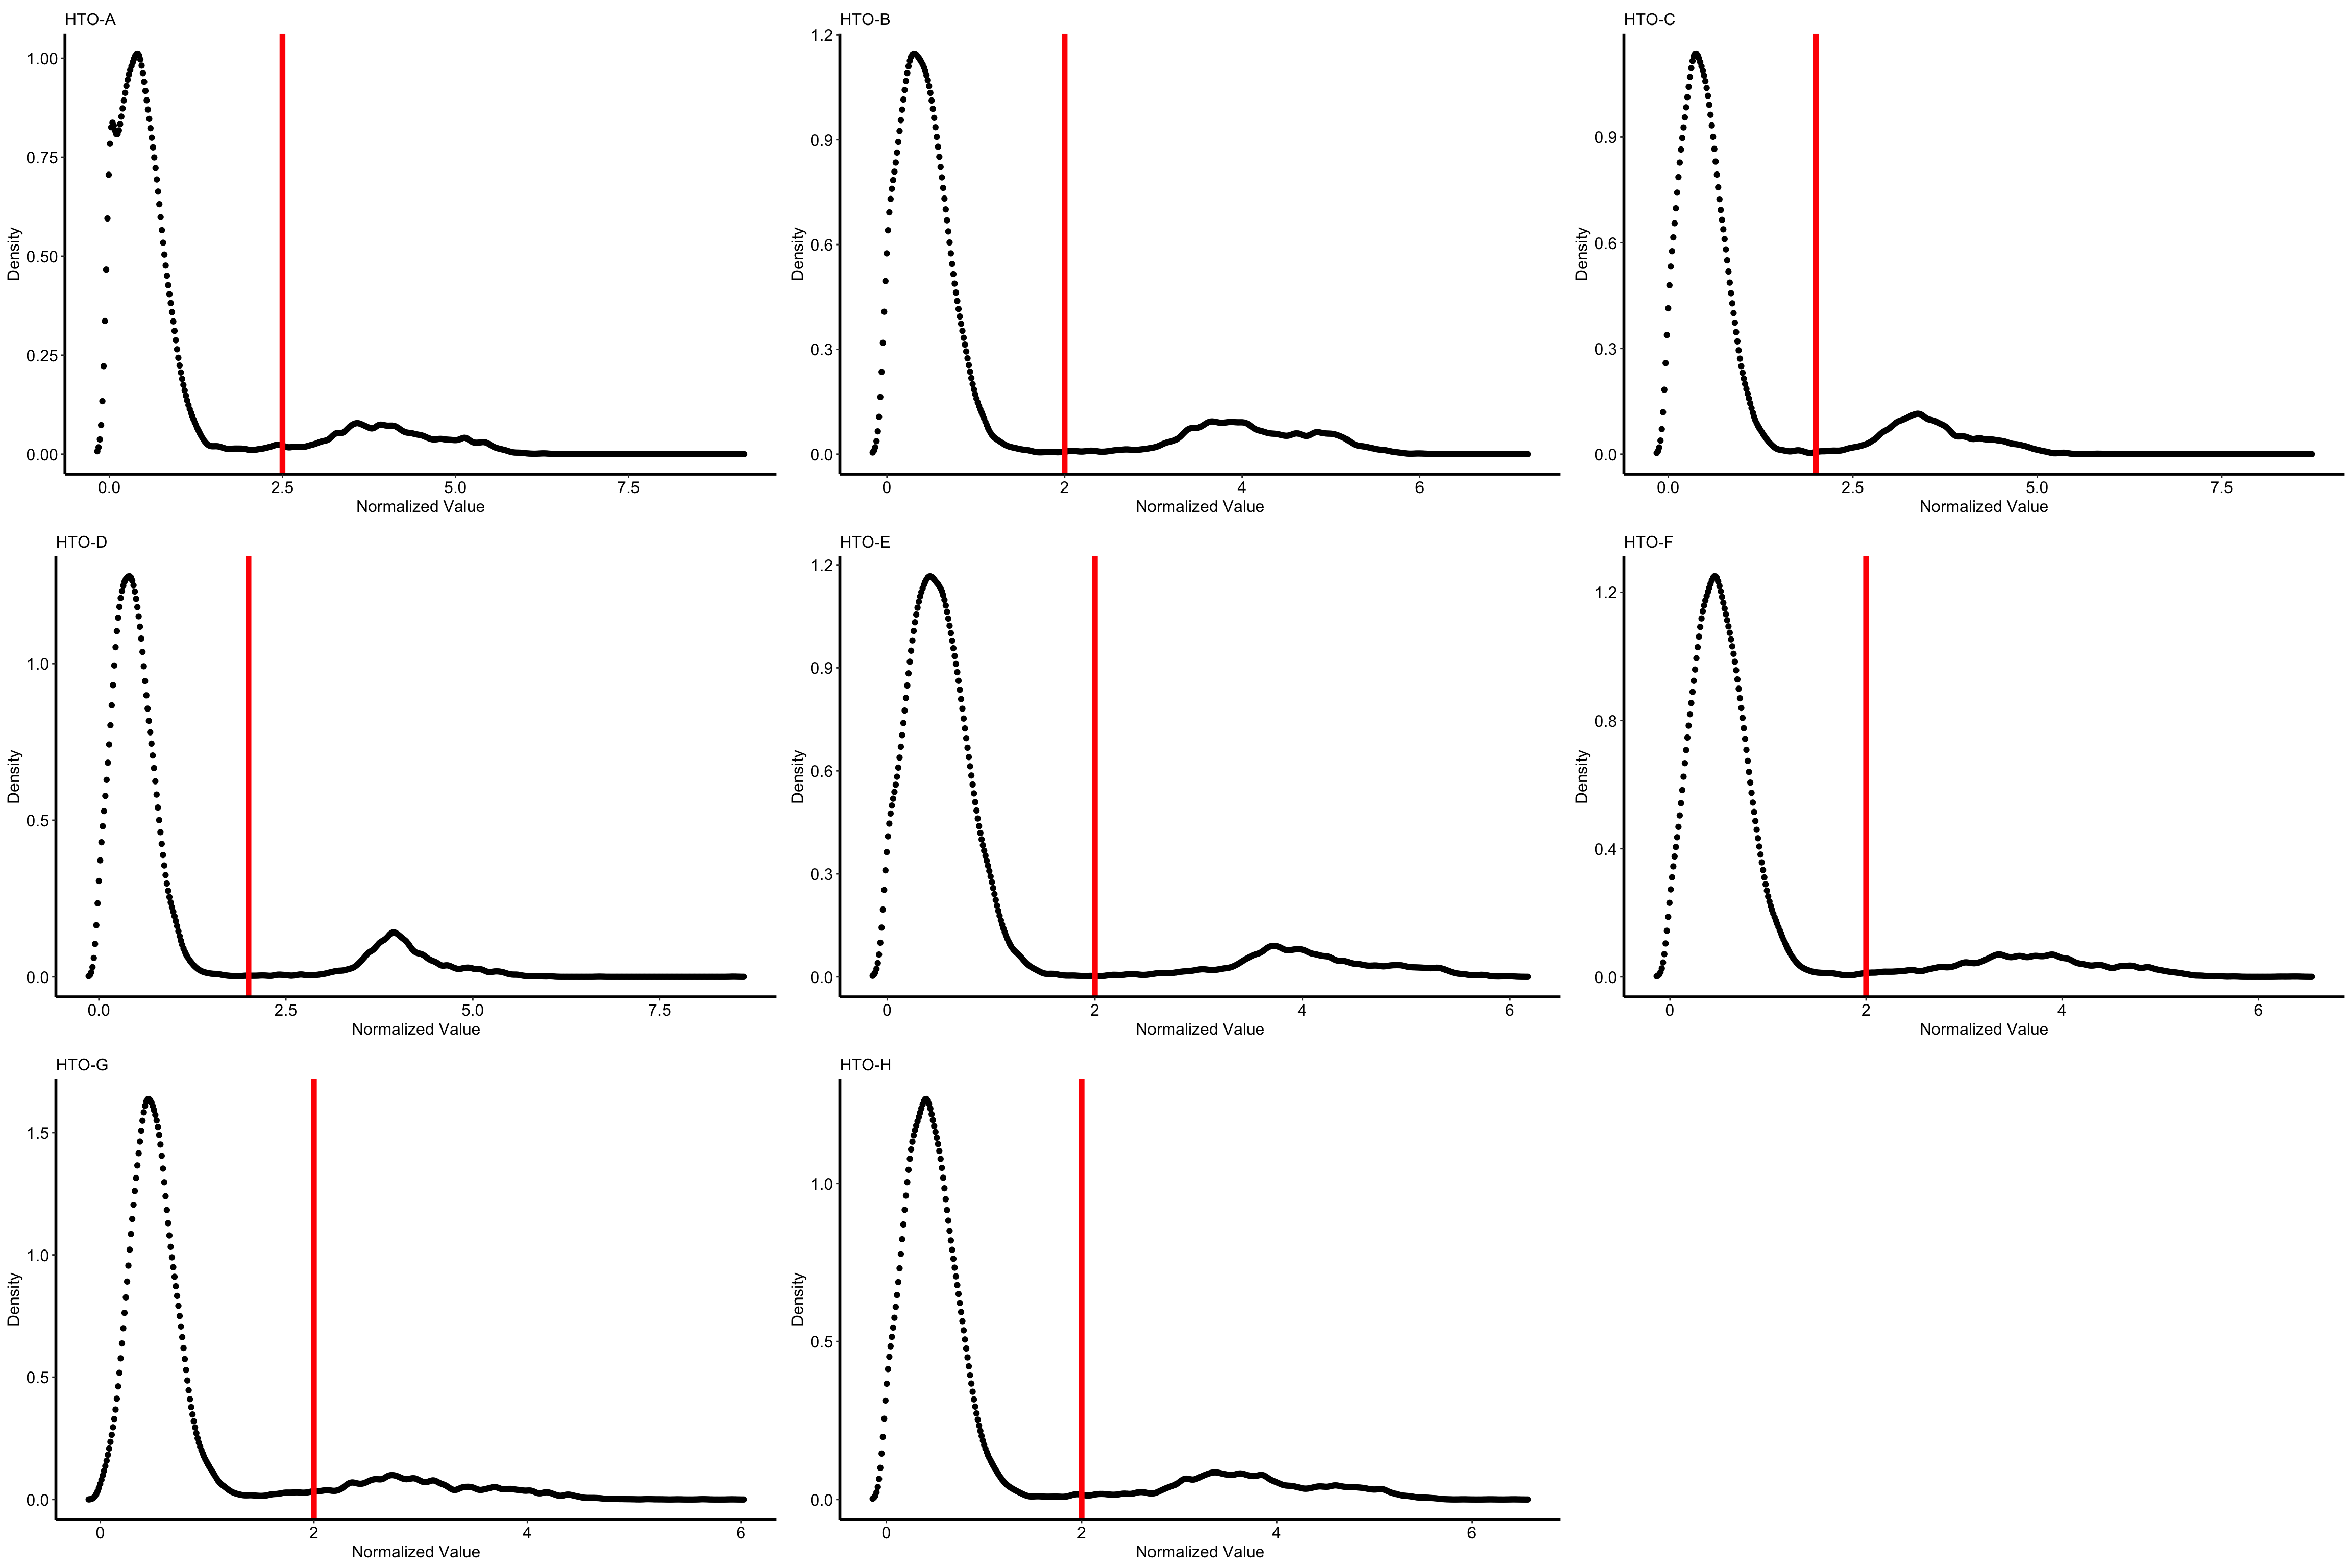
Users can use PlotHTO function to check the quality of the cutoff of each HTO
plots1 <- PlotHTO(pbmc.hashtag, assay = 'HTO', method = 'CLR')
this function returns a list of ggplot objects, use plot_grid function to plot them:
plot_grid(plotlist = plots1)
Users can also specify the cutoff manually:
pbmc.hashtag <- HTOClassification(pbmc.hashtag, assay = 'HTO', method = 'CLR', specify_cutoff = c(2.5,2,2,2,2,2,2,2))
or use a different normalization method (CLR or log):
pbmc.hashtag <- HTOClassification(pbmc.hashtag, assay = 'HTO', method = 'log')
users also can specify the cutoff manually for PlotHTO function to find out the best cutoff:
plots1 <- PlotHTO(pbmc.hashtag, assay = 'HTO', method = 'CLR', specify_cutoff = c(2.5,2,2,2,2,2,2,2))
LeiLi-Uchicago/HTOreader documentation built on Aug. 14, 2024, 8:38 p.m.
R Package Documentation
Browse R Packages
We want your feedback!
Note that we can't provide technical support on individual packages. You should contact the package authors for that.
HTOreader
An R toolkit for cell hashing (HTO) demultiplexing
How to install
make sure you installed these two dependencies:
install.packages("flexmix") install.packages("hash")
then:
if (!require("devtools")) {install.packages("devtools")}
devtools::install_github("WilsonImmunologyLab/HTOreader")
Hnads on Example of Hybrid demultiplexing using real-world data
Please click the following link for a detailed example
![]()
![]()
Please refer to /docs folder of this repository. We have provided the HTML version and the R markdown file. Data for this sample under /data folder.
Quick start
The pbmc.hashtag in the following example is a Seurat object. Please load your "HTO" assay using the Seurat package (More details in our example).
There are two main functions, HTOClassification for Hashtag demultiplexing, PlotHTO for plotting distributions of hashtags
pbmc.hashtag <- HTOClassification(pbmc.hashtag, assay = 'HTO', method = 'CLR')
VlnPlot(pbmc.hashtag,features = rownames(pbmc.hashtag@assays[["HTO"]]@data), group.by = 'HTOid')
Users can use PlotHTO function to check the quality of the cutoff of each HTO
plots1 <- PlotHTO(pbmc.hashtag, assay = 'HTO', method = 'CLR')
this function returns a list of ggplot objects, use plot_grid function to plot them:
plot_grid(plotlist = plots1)
Users can also specify the cutoff manually:
pbmc.hashtag <- HTOClassification(pbmc.hashtag, assay = 'HTO', method = 'CLR', specify_cutoff = c(2.5,2,2,2,2,2,2,2))
or use a different normalization method (CLR or log):
pbmc.hashtag <- HTOClassification(pbmc.hashtag, assay = 'HTO', method = 'log')
users also can specify the cutoff manually for PlotHTO function to find out the best cutoff:
plots1 <- PlotHTO(pbmc.hashtag, assay = 'HTO', method = 'CLR', specify_cutoff = c(2.5,2,2,2,2,2,2,2))
R Package Documentation
Browse R Packages
We want your feedback!
Note that we can't provide technical support on individual packages. You should contact the package authors for that.
Embedding an R snippet on your website
Add the following code to your website.
For more information on customizing the embed code, read Embedding Snippets.