In Roche/rtables: Reporting Tables
knitr::opts_chunk$set(
  collapse = TRUE,
  comment = "#>",
  fig.path = "man/figures/README-"
)
suppressPackageStartupMessages(library(rtables))
suppressPackageStartupMessages(library(dplyr))
rtables 


Reporting Tables with R
The rtables R package was designed to create and display complex tables with R. The cells in an rtable may contain
any high-dimensional data structure which can then be displayed with cell-specific formatting instructions. Currently,
rtables can be outputted in ascii html, and pdf, as well Power Point (via conversion to flextable objects). rtf support is in development and will be in a future release.
rtables is developed and copy written by F. Hoffmann-La Roche and it is released open source under Apache
License Version 2.
rtables development is driven by the need to create regulatory ready tables for health authority review. Some of the key requirements for this undertaking are listed below:
- cell values and their visualization separate (i.e. no string based tables)
- values need to be programmatically accessible in their non-rounded state for cross-checking
- multiple values displayed within a cell
- flexible tabulation framework
- flexible formatting (cell spans, rounding, alignment, etc.)
- multiple output formats (html, ascii, latex, pdf, xml)
- flexible pagination in both horizontal and vertical directions
- distinguish between name and label in the data structure to work with
CDISC standards
- title, footnotes, cell cell/row/column references
rtables currently covers virtually all of these requirements, and further advances remain under active development.
Installation
rtables is available on CRAN and you can install the latest released version with:
install.packages("rtables")
or you can install the latest development version directly from GitHub with:
# install.packages("pak")
pak::pak("insightsengineering/rtables")
Packaged releases (both those on CRAN and those between official CRAN releases) can be
found in the releases list.
To understand how to use this package, please refer to the Introduction to rtables article, which provides multiple examples of code implementation.
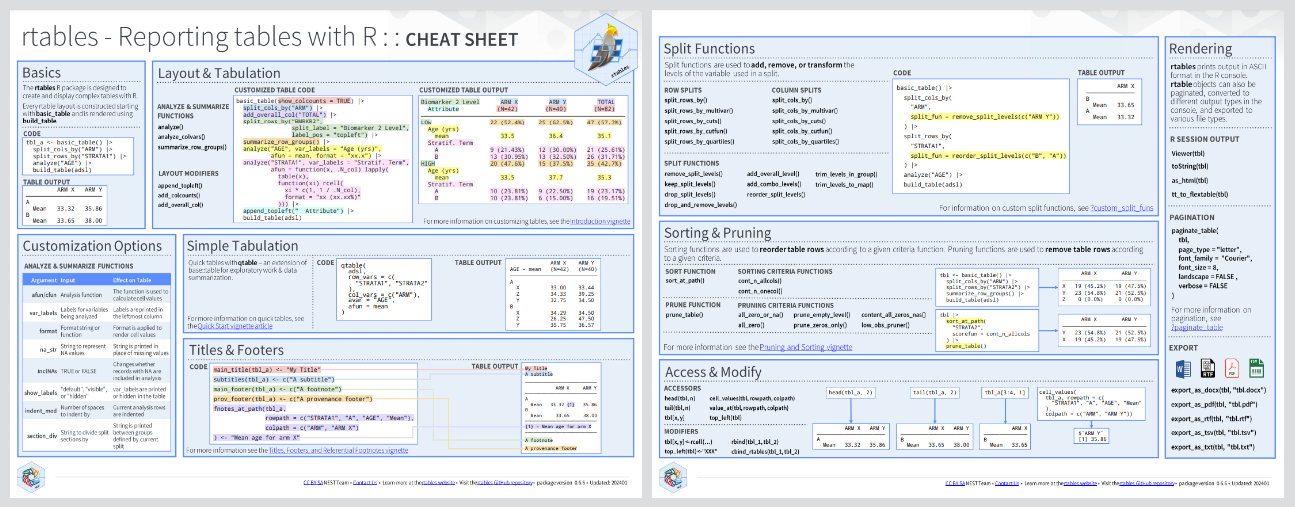
Cheatsheet
Usage
We first demonstrate with a demographic table-like example and then show the creation of a more complex table.
library(rtables)

lyt <- basic_table() %>%
  split_cols_by("ARM") %>%
  analyze(c("AGE", "BMRKR1", "BMRKR2"), function(x, ...) {
    if (is.numeric(x)) {
      in_rows(
        "Mean (sd)" = c(mean(x), sd(x)),
        "Median" = median(x),
        "Min - Max" = range(x),
        .formats = c("xx.xx (xx.xx)", "xx.xx", "xx.xx - xx.xx")
      )
    } else if (is.factor(x) || is.character(x)) {
      in_rows(.list = list_wrap_x(table)(x))
    } else {
      stop("type not supported")
    }
  })

build_table(lyt, ex_adsl)
library(rtables)
library(dplyr)

## for simplicity grab non-sparse subset
ADSL <- ex_adsl %>% filter(RACE %in% levels(RACE)[1:3])

biomarker_ave <- function(x, ...) {
  val <- if (length(x) > 0) round(mean(x), 2) else "no data"
  in_rows(
    "Biomarker 1 (mean)" = rcell(val)
  )
}

basic_table(show_colcounts = TRUE) %>%
  split_cols_by("ARM") %>%
  split_cols_by("BMRKR2") %>%
  split_rows_by("RACE", split_fun = trim_levels_in_group("SEX")) %>%
  split_rows_by("SEX") %>%
  summarize_row_groups() %>%
  analyze("BMRKR1", biomarker_ave) %>%
  build_table(ADSL)
Acknowledgments
We would like to thank everyone who has made rtables a better project by providing feedback and improving examples & vignettes. The following list of contributors is alphabetical:
Maximo Carreras, Francois Collins, Saibah Chohan, Tadeusz Lewandowski, Nick Paszty, Nina Qi, Jana Stoilova, Heng Wang, Godwin Yung
Presentations
- R in Pharma 2023
- Generating Tables, Listings, and Graphs using NEST / cardinal [Video]
- BBS Session on Regulatory Submissions of Clinical Trials [Video]
- R Medicine Virtual Conference 2023 [Video]
- Advanced rtables Training 2023 [Part 1 Slides] [Part 2 Slides]
- R in Pharma 2022 - Creating Submission-Quality Clinical Trial Reporting Tables in R with rtables [Slides] [Video]
- R Consortium 2022
- R Adoption Series - Reporting Table Creation in R [Video] [Slides]
- Tables in Clinical Trials with R [Book]
- useR! 2020 - rtables Layouting and Tabulation Framework [Video]
Roche/rtables documentation built on April 11, 2025, 4:26 p.m.
R Package Documentation
Browse R Packages
We want your feedback!
Note that we can't provide technical support on individual packages. You should contact the package authors for that.
knitr::opts_chunk$set( collapse = TRUE, comment = "#>", fig.path = "man/figures/README-" ) suppressPackageStartupMessages(library(rtables)) suppressPackageStartupMessages(library(dplyr))
rtables
![]()
![]()
![]()
Reporting Tables with R
The rtables R package was designed to create and display complex tables with R. The cells in an rtable may contain
any high-dimensional data structure which can then be displayed with cell-specific formatting instructions. Currently,
rtables can be outputted in ascii html, and pdf, as well Power Point (via conversion to flextable objects). rtf support is in development and will be in a future release.
rtables is developed and copy written by F. Hoffmann-La Roche and it is released open source under Apache
License Version 2.
rtables development is driven by the need to create regulatory ready tables for health authority review. Some of the key requirements for this undertaking are listed below:
- cell values and their visualization separate (i.e. no string based tables)
- values need to be programmatically accessible in their non-rounded state for cross-checking
- multiple values displayed within a cell
- flexible tabulation framework
- flexible formatting (cell spans, rounding, alignment, etc.)
- multiple output formats (html, ascii, latex, pdf, xml)
- flexible pagination in both horizontal and vertical directions
- distinguish between name and label in the data structure to work with
CDISCstandards - title, footnotes, cell cell/row/column references
rtables currently covers virtually all of these requirements, and further advances remain under active development.
Installation
rtables is available on CRAN and you can install the latest released version with:
install.packages("rtables")
or you can install the latest development version directly from GitHub with:
# install.packages("pak") pak::pak("insightsengineering/rtables")
Packaged releases (both those on CRAN and those between official CRAN releases) can be found in the releases list.
To understand how to use this package, please refer to the Introduction to rtables article, which provides multiple examples of code implementation.
Cheatsheet
Usage
We first demonstrate with a demographic table-like example and then show the creation of a more complex table.
library(rtables) lyt <- basic_table() %>% split_cols_by("ARM") %>% analyze(c("AGE", "BMRKR1", "BMRKR2"), function(x, ...) { if (is.numeric(x)) { in_rows( "Mean (sd)" = c(mean(x), sd(x)), "Median" = median(x), "Min - Max" = range(x), .formats = c("xx.xx (xx.xx)", "xx.xx", "xx.xx - xx.xx") ) } else if (is.factor(x) || is.character(x)) { in_rows(.list = list_wrap_x(table)(x)) } else { stop("type not supported") } }) build_table(lyt, ex_adsl)
library(rtables) library(dplyr) ## for simplicity grab non-sparse subset ADSL <- ex_adsl %>% filter(RACE %in% levels(RACE)[1:3]) biomarker_ave <- function(x, ...) { val <- if (length(x) > 0) round(mean(x), 2) else "no data" in_rows( "Biomarker 1 (mean)" = rcell(val) ) } basic_table(show_colcounts = TRUE) %>% split_cols_by("ARM") %>% split_cols_by("BMRKR2") %>% split_rows_by("RACE", split_fun = trim_levels_in_group("SEX")) %>% split_rows_by("SEX") %>% summarize_row_groups() %>% analyze("BMRKR1", biomarker_ave) %>% build_table(ADSL)
Acknowledgments
We would like to thank everyone who has made rtables a better project by providing feedback and improving examples & vignettes. The following list of contributors is alphabetical:
Maximo Carreras, Francois Collins, Saibah Chohan, Tadeusz Lewandowski, Nick Paszty, Nina Qi, Jana Stoilova, Heng Wang, Godwin Yung
Presentations
- R in Pharma 2023
- Generating Tables, Listings, and Graphs using NEST / cardinal [Video]
- BBS Session on Regulatory Submissions of Clinical Trials [Video]
- R Medicine Virtual Conference 2023 [Video]
- Advanced rtables Training 2023 [Part 1 Slides] [Part 2 Slides]
- R in Pharma 2022 - Creating Submission-Quality Clinical Trial Reporting Tables in R with rtables [Slides] [Video]
- R Consortium 2022
- R Adoption Series - Reporting Table Creation in R [Video] [Slides]
- Tables in Clinical Trials with R [Book]
- useR! 2020 - rtables Layouting and Tabulation Framework [Video]
R Package Documentation
Browse R Packages
We want your feedback!
Note that we can't provide technical support on individual packages. You should contact the package authors for that.
Embedding an R snippet on your website
Add the following code to your website.
For more information on customizing the embed code, read Embedding Snippets.