inst/examples/myers-exploration.md
In cboettig/nonparametric-bayes: Nonparametric Bayes inference for ecological models
Fixed priors on hyperparameters, fixed model type.
s2.p <- c(50,50)  # inverse gamma mean is
tau2.p <- c(20,1)
d.p = c(10, 1/0.01, 10, 1/0.01)
nug.p = c(10, 1/0.01, 10, 1/0.01) # gamma mean
s2_prior <- function(x) dinvgamma(x, s2.p[1], s2.p[2])
tau2_prior <- function(x) dinvgamma(x, tau2.p[1], tau2.p[2])
d_prior <- function(x) dgamma(x, d.p[1], scale = d.p[2]) + dgamma(x, d.p[3], scale = d.p[4])
nug_prior <- function(x) dgamma(x, nug.p[1], scale = nug.p[2]) + dgamma(x, nug.p[3], scale = nug.p[4])
beta0_prior <- function(x, tau) dnorm(x, 0, tau)
beta = c(0)
priors <- list(s2 = s2_prior, tau2 = tau2_prior, beta0 = dnorm, nug = nug_prior, d = d_prior, ldetK = function(x) 0)
profit = function(x,h) pmin(x, h)
delta <- 0.01
OptTime = 20  # stationarity with unstable models is tricky thing
reward = 0
xT <- 0
z_g = function() rlnorm(1, 0, sigma_g)
z_m = function() 1+(2*runif(1, 0,  1)-1) * sigma_m
f <- RickerAllee
p <- c(1.1, 10, 5)
K <- 10
allee <- 5
# valid only for p[2] = 2
#K <- p[1] * p[3] / 2 + sqrt( (p[1] * p[3]) ^ 2 - 4 * p[3] ) / 2 #
#allee <- p[1] * p[3] / 2 - sqrt( (p[1] * p[3]) ^ 2 - 4 * p[3] ) / 2 # allee threshold
#e_star <- (p[1] * sqrt(p[3]) - 2) / 2 ## Bifurcation point
sigma_g <- 0.05
sigma_m <- 0.02
x_grid <- seq(0, 1.5 * K, length=101)
h_grid <- x_grid
With parameters 1.1, 10, 5.
sim_obs <- function(Xo, z_g, f, p, Tobs = 40, seed = 1){
x <- numeric(Tobs)
x[1] <- Xo
set.seed(seed)
for(t in 1:(Tobs-1))
x[t+1] = z_g() * f(x[t], h=0, p=p)
data_plot <- qplot(1:Tobs, x) + ggtitle(paste("seed", seed))
print(data_plot)
obs <- data.frame(x=c(0,x[1:(Tobs-1)]),y=c(0,x[2:Tobs]))
obs
}
par_est <- function(obs){
estf <- function(p){
mu <- log(obs$x) + p["r"]*(1-obs$x/p["K"])
llik <- -sum(dlnorm(obs$y, mu, p["s"]), log=TRUE)
if(!is.numeric(llik) | is.nan(llik) | !(llik < Inf)){
warning("possible error in llik")
llik <- 1e30
}
llik
}
o <- optim(par = c(r=1,K=mean(obs$x),s=1), estf, method="L", lower=c(1e-3,1e-3,1e-3))
f_alt <- Ricker
p_alt <- c(o$par['r'], o$par['K'])
sigma_g_alt <- o$par['s']
list(f_alt = f_alt, p_alt = p_alt, sigma_g_alt = sigma_g_alt)
}
optimal_policy <- function(gp, f, f_alt, p, p_alt, x_grid, h_grid, sigma_g, sigma_g_alt, delta, xT, profit, reward, OptTime){
matrices_gp <- gp_transition_matrix(gp$ZZ.km, gp$ZZ.ks2, x_grid, h_grid)
opt_gp <- find_dp_optim(matrices_gp, x_grid, h_grid, OptTime, xT, profit, delta, reward=reward)
matrices_true <- f_transition_matrix(f, p, x_grid, h_grid, sigma_g)
opt_true <- find_dp_optim(matrices_true, x_grid, h_grid, OptTime, xT, profit, delta=delta, reward = reward)
matrices_estimated <- f_transition_matrix(f_alt, p_alt, x_grid, h_grid, sigma_g_alt)
opt_estimated <- find_dp_optim(matrices_estimated, x_grid, h_grid, OptTime, xT, profit, delta=delta, reward = reward)
list(gp_D = opt_gp$D[,1], true_D = opt_true$D[,1], est_D = opt_estimated$D[,1])
}
simulate_opt <- function(OPT, f, p, x_grid, h_grid, x0, z_g, profit){
gp_D <- sapply(1:OptTime, function(i) OPT$gp_D)
true_D <- sapply(1:OptTime, function(i) OPT$true_D)
est_D <- sapply(1:OptTime, function(i) OPT$est_D)
set.seed(1)
sim_gp <- lapply(1:100, function(i) ForwardSimulate(f, p, x_grid, h_grid, x0, gp_D, z_g, profit=profit))
set.seed(1)
sim_true <- lapply(1:100, function(i) ForwardSimulate(f, p, x_grid, h_grid, x0, true_D, z_g, profit=profit))
set.seed(1)
sim_est <- lapply(1:100, function(i) ForwardSimulate(f, p, x_grid, h_grid, x0, est_D, z_g, profit=profit))
dat <- list(GP = sim_gp, Parametric = sim_est, True = sim_true)
dat <- melt(dat, id=names(dat[[1]][[1]]))
dt <- data.table(dat)
setnames(dt, c("L1", "L2"), c("method", "reps"))
dt
}
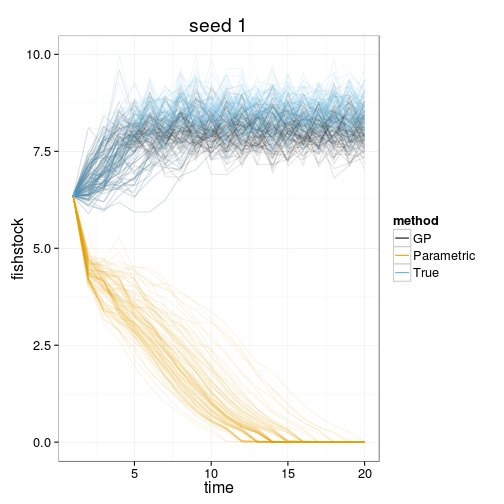
sim_plots <- function(dt, seed=1){
fish_plot <- ggplot(dt) +
geom_line(aes(time, fishstock, group=interaction(reps,method), color=method), alpha=.1) +
scale_colour_manual(values=cbPalette, guide = guide_legend(override.aes = list(alpha = 1)))+
ggtitle(paste("seed", seed))
print(fish_plot)
harvest_plot <- ggplot(dt) +
geom_line(aes(time, harvest, group=interaction(reps,method), color=method), alpha=.1) +
scale_colour_manual(values=cbPalette, guide = guide_legend(override.aes = list(alpha = 1))) +
ggtitle(paste("seed", seed))
print(harvest_plot)
}
profits_stats <- function(dt){
profits <- dt[, sum(profit), by = c("reps", "method")]
means <- profits[, mean(V1), by = method]
sds <- profits[, sd(V1), by = method]
yield <- cbind(means, sd = sds$V1)
yield
}
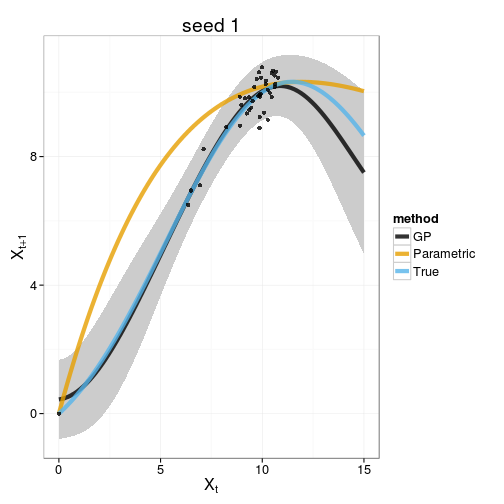
gp_plot <- function(gp, f, p, f_alt, p_alt, x_grid, obs, seed){
tgp_dat <-
data.frame( x = gp$XX[[1]],
y = gp$ZZ.km,
ymin = gp$ZZ.km - 1.96 * sqrt(gp$ZZ.ks2),
ymax = gp$ZZ.km + 1.96 * sqrt(gp$ZZ.ks2))
true <- sapply(x_grid, f, 0, p)
est <- sapply(x_grid, f_alt, 0, p_alt)
models <- data.frame(x=x_grid, GP=tgp_dat$y, Parametric=est, True=true)
models <- melt(models, id="x")
names(models) <- c("x", "method", "value")
plot_gp <- ggplot(tgp_dat) + geom_ribbon(aes(x,y,ymin=ymin,ymax=ymax), fill="gray80") +
geom_line(data=models, aes(x, value, col=method), lwd=2, alpha=0.8) +
geom_point(data=obs, aes(x,y), alpha=0.8) +
xlab(expression(X[t])) + ylab(expression(X[t+1])) +
scale_colour_manual(values=cbPalette) +
ggtitle(paste("seed", seed))
print(plot_gp)
}
posteriors_plot <- function(gp, priors){
hyperparameters <- c("index", "s2", "tau2", "beta0", "nug", "d", "ldetK")
posteriors <- melt(gp$trace$XX[[1]][,hyperparameters], id="index")
prior_curves <- ddply(posteriors, "variable", function(dd){
grid <- seq(min(dd$value), max(dd$value), length = 100)
data.frame(value = grid, density = priors[[dd$variable[1]]](grid))
})
plot_posteriors <- ggplot(posteriors) +
#geom_density(aes(value), lwd=2) +
geom_histogram(aes(x=value, y=..density..), alpha=0.7) +
geom_line(data=prior_curves, aes(x=value, y=density), col="red", lwd=2) +
facet_wrap(~ variable, scale="free")
print(plot_posteriors)
}
require(snowfall)
sfInit(par=TRUE, cpu=8)
sfExportAll()
sfLibrary(pdgControl)
sfLibrary(nonparametricbayes)
sfLibrary(reshape2)
sfLibrary(ggplot2)
sfLibrary(data.table)
sfLibrary(tgp)
sfLibrary(kernlab)
sfLibrary(MCMCpack)
sfLibrary(plyr)
seed <- round(runif(32) * 1e6)
seed[1] <- 1
seed
 [1]      1 969343 449127 263444 674131 949894 913719 444907 989690 229414
[11] 865064 804050 965462 777512 497134  65605 141485 193569 259734 451474
[21] 695013 530379 124241 497581 611219 718556 620409  26555  71806 717469
[31] 393034 540837
yields <- lapply(seed,
function(seed_i){
  Xo <- allee + x_grid[10] # observations start from
  x0 <- Xo # simulation under policy starts from
  obs <- sim_obs(Xo, z_g, f, p, Tobs=40, seed = seed_i)
  est <- par_est(obs)
  gp <- bgp(X=obs$x, XX=x_grid, Z=obs$y, verb=0,
          meanfn="constant", bprior="b0", BTE=c(2000,16000,2),
          m0r1=FALSE, corr="exp", trace=FALSE,
          beta = beta, s2.p = s2.p, d.p = d.p, nug.p = nug.p, tau2.p = tau2.p,
          s2.lam = "fixed", d.lam = "fixed", nug.lam = "fixed", tau2.lam = "fixed")
  gp_plot(gp, f, p, est$f_alt, est$p_alt, x_grid, obs, seed_i)
#  posteriors_plot(gp, priors) # needs trace=TRUE!
  OPT <- optimal_policy(gp, f, est$f_alt, p, est$p_alt, x_grid, h_grid, sigma_g, est$sigma_g_alt, delta, xT, profit, reward, OptTime)
  dt <- simulate_opt(OPT, f, p, x_grid, h_grid, x0, z_g, profit)
  sim_plots(dt, seed=seed_i)
  profits_stats(dt)
})


yields <- melt(yields, id=c("method", "V1", "sd"))
ggplot(yields) + geom_histogram(aes(V1)) + facet_wrap(~method, scale='free')
stat_bin: binwidth defaulted to range/30. Use 'binwidth = x' to adjust
this.
stat_bin: binwidth defaulted to range/30. Use 'binwidth = x' to adjust
this.
stat_bin: binwidth defaulted to range/30. Use 'binwidth = x' to adjust
this.
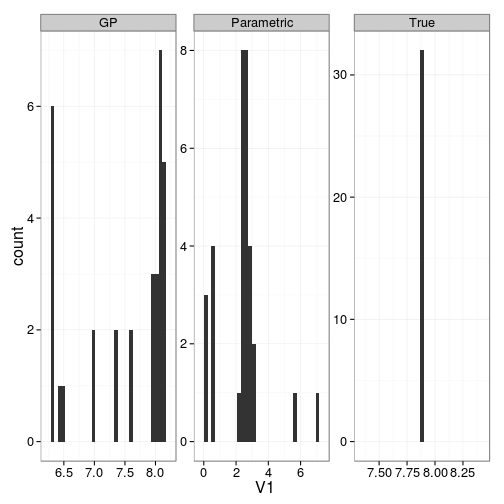
yields
       method     V1      sd L1
1          GP 8.1300 1.69491  1
2  Parametric 2.4240 0.27111  1
3        True 7.8840 1.76601  1
4          GP 8.0174 1.67504  2
5  Parametric 2.6360 0.34841  2
6        True 7.8840 1.76601  2
7          GP 6.4140 1.44192  3
8  Parametric 0.5685 0.36637  3
9        True 7.8840 1.76601  3
10         GP 7.6080 1.55418  4
11 Parametric 0.1485 0.15739  4
12       True 7.8840 1.76601  4
13         GP 8.0955 1.69390  5
14 Parametric 0.0915 0.11850  5
15       True 7.8840 1.76601  5
16         GP 6.3000 0.00000  6
17 Parametric 2.7797 0.22161  6
18       True 7.8840 1.76601  6
19         GP 8.0745 1.66938  7
20 Parametric 2.5102 0.41036  7
21       True 7.8840 1.76601  7
22         GP 6.3000 0.00000  8
23 Parametric 2.8819 1.13615  8
24       True 7.8840 1.76601  8
25         GP 8.0775 1.66520  9
26 Parametric 0.5685 0.36637  9
27       True 7.8840 1.76601  9
28         GP 8.1225 1.69992 10
29 Parametric 2.7786 0.08342 10
30       True 7.8840 1.76601 10
31         GP 8.0759 1.66078 11
32 Parametric 2.5931 0.36977 11
33       True 7.8840 1.76601 11
34         GP 8.0835 1.72560 12
35 Parametric 6.9945 1.95619 12
36       True 7.8840 1.76601 12
37         GP 7.3545 1.49506 13
38 Parametric 2.3198 0.41146 13
39       True 7.8840 1.76601 13
40         GP 8.0775 1.66520 14
41 Parametric 2.5945 0.23523 14
42       True 7.8840 1.76601 14
43         GP 6.3000 0.00000 15
44 Parametric 0.5685 0.36637 15
45       True 7.8840 1.76601 15
46         GP 6.9930 1.46548 16
47 Parametric 2.5945 0.23523 16
48       True 7.8840 1.76601 16
49         GP 8.1120 1.69715 17
50 Parametric 2.3114 0.23917 17
51       True 7.8840 1.76601 17
52         GP 7.3200 1.51222 18
53 Parametric 2.6059 0.27427 18
54       True 7.8840 1.76601 18
55         GP 8.1180 1.69388 19
56 Parametric 0.5685 0.36637 19
57       True 7.8840 1.76601 19
58         GP 8.0220 1.74766 20
59 Parametric 5.5725 1.70885 20
60       True 7.8840 1.76601 20
61         GP 7.6080 1.55418 21
62 Parametric 3.1926 1.10508 21
63       True 7.8840 1.76601 21
64         GP 6.4695 1.43474 22
65 Parametric 2.3919 0.39680 22
66       True 7.8840 1.76601 22
67         GP 7.9830 1.63145 23
68 Parametric 2.2469 0.16183 23
69       True 7.8840 1.76601 23
70         GP 8.1285 1.69568 24
71 Parametric 2.6167 0.22072 24
72       True 7.8840 1.76601 24
73         GP 6.9960 1.46792 25
74 Parametric 2.4249 0.12660 25
75       True 7.8840 1.76601 25
76         GP 6.3000 0.00000 26
77 Parametric 3.1950 0.95032 26
78       True 7.8840 1.76601 26
79         GP 7.9830 1.63145 27
80 Parametric 2.5022 0.31409 27
81       True 7.8840 1.76601 27
82         GP 6.3000 0.00000 28
83 Parametric 2.3670 0.23987 28
84       True 7.8840 1.76601 28
85         GP 7.9830 1.63145 29
86 Parametric 2.5945 0.23523 29
87       True 7.8840 1.76601 29
88         GP 8.0175 1.75271 30
89 Parametric 2.8178 0.08035 30
90       True 7.8840 1.76601 30
91         GP 8.1285 1.69568 31
92 Parametric 2.5992 0.27697 31
93       True 7.8840 1.76601 31
94         GP 6.3000 0.00000 32
95 Parametric 0.0660 0.11144 32
96       True 7.8840 1.76601 32
NULL
cboettig/nonparametric-bayes documentation built on May 13, 2019, 2:09 p.m.
R Package Documentation
Browse R Packages
We want your feedback!
Note that we can't provide technical support on individual packages. You should contact the package authors for that.
Fixed priors on hyperparameters, fixed model type.
s2.p <- c(50,50) # inverse gamma mean is
tau2.p <- c(20,1)
d.p = c(10, 1/0.01, 10, 1/0.01)
nug.p = c(10, 1/0.01, 10, 1/0.01) # gamma mean
s2_prior <- function(x) dinvgamma(x, s2.p[1], s2.p[2])
tau2_prior <- function(x) dinvgamma(x, tau2.p[1], tau2.p[2])
d_prior <- function(x) dgamma(x, d.p[1], scale = d.p[2]) + dgamma(x, d.p[3], scale = d.p[4])
nug_prior <- function(x) dgamma(x, nug.p[1], scale = nug.p[2]) + dgamma(x, nug.p[3], scale = nug.p[4])
beta0_prior <- function(x, tau) dnorm(x, 0, tau)
beta = c(0)
priors <- list(s2 = s2_prior, tau2 = tau2_prior, beta0 = dnorm, nug = nug_prior, d = d_prior, ldetK = function(x) 0)
profit = function(x,h) pmin(x, h)
delta <- 0.01
OptTime = 20 # stationarity with unstable models is tricky thing
reward = 0
xT <- 0
z_g = function() rlnorm(1, 0, sigma_g)
z_m = function() 1+(2*runif(1, 0, 1)-1) * sigma_m
f <- RickerAllee
p <- c(1.1, 10, 5)
K <- 10
allee <- 5
# valid only for p[2] = 2
#K <- p[1] * p[3] / 2 + sqrt( (p[1] * p[3]) ^ 2 - 4 * p[3] ) / 2 #
#allee <- p[1] * p[3] / 2 - sqrt( (p[1] * p[3]) ^ 2 - 4 * p[3] ) / 2 # allee threshold
#e_star <- (p[1] * sqrt(p[3]) - 2) / 2 ## Bifurcation point
sigma_g <- 0.05
sigma_m <- 0.02
x_grid <- seq(0, 1.5 * K, length=101)
h_grid <- x_grid
With parameters 1.1, 10, 5.
sim_obs <- function(Xo, z_g, f, p, Tobs = 40, seed = 1){
x <- numeric(Tobs)
x[1] <- Xo
set.seed(seed)
for(t in 1:(Tobs-1))
x[t+1] = z_g() * f(x[t], h=0, p=p)
data_plot <- qplot(1:Tobs, x) + ggtitle(paste("seed", seed))
print(data_plot)
obs <- data.frame(x=c(0,x[1:(Tobs-1)]),y=c(0,x[2:Tobs]))
obs
}
par_est <- function(obs){
estf <- function(p){
mu <- log(obs$x) + p["r"]*(1-obs$x/p["K"])
llik <- -sum(dlnorm(obs$y, mu, p["s"]), log=TRUE)
if(!is.numeric(llik) | is.nan(llik) | !(llik < Inf)){
warning("possible error in llik")
llik <- 1e30
}
llik
}
o <- optim(par = c(r=1,K=mean(obs$x),s=1), estf, method="L", lower=c(1e-3,1e-3,1e-3))
f_alt <- Ricker
p_alt <- c(o$par['r'], o$par['K'])
sigma_g_alt <- o$par['s']
list(f_alt = f_alt, p_alt = p_alt, sigma_g_alt = sigma_g_alt)
}
optimal_policy <- function(gp, f, f_alt, p, p_alt, x_grid, h_grid, sigma_g, sigma_g_alt, delta, xT, profit, reward, OptTime){
matrices_gp <- gp_transition_matrix(gp$ZZ.km, gp$ZZ.ks2, x_grid, h_grid)
opt_gp <- find_dp_optim(matrices_gp, x_grid, h_grid, OptTime, xT, profit, delta, reward=reward)
matrices_true <- f_transition_matrix(f, p, x_grid, h_grid, sigma_g)
opt_true <- find_dp_optim(matrices_true, x_grid, h_grid, OptTime, xT, profit, delta=delta, reward = reward)
matrices_estimated <- f_transition_matrix(f_alt, p_alt, x_grid, h_grid, sigma_g_alt)
opt_estimated <- find_dp_optim(matrices_estimated, x_grid, h_grid, OptTime, xT, profit, delta=delta, reward = reward)
list(gp_D = opt_gp$D[,1], true_D = opt_true$D[,1], est_D = opt_estimated$D[,1])
}
simulate_opt <- function(OPT, f, p, x_grid, h_grid, x0, z_g, profit){
gp_D <- sapply(1:OptTime, function(i) OPT$gp_D)
true_D <- sapply(1:OptTime, function(i) OPT$true_D)
est_D <- sapply(1:OptTime, function(i) OPT$est_D)
set.seed(1)
sim_gp <- lapply(1:100, function(i) ForwardSimulate(f, p, x_grid, h_grid, x0, gp_D, z_g, profit=profit))
set.seed(1)
sim_true <- lapply(1:100, function(i) ForwardSimulate(f, p, x_grid, h_grid, x0, true_D, z_g, profit=profit))
set.seed(1)
sim_est <- lapply(1:100, function(i) ForwardSimulate(f, p, x_grid, h_grid, x0, est_D, z_g, profit=profit))
dat <- list(GP = sim_gp, Parametric = sim_est, True = sim_true)
dat <- melt(dat, id=names(dat[[1]][[1]]))
dt <- data.table(dat)
setnames(dt, c("L1", "L2"), c("method", "reps"))
dt
}
sim_plots <- function(dt, seed=1){
fish_plot <- ggplot(dt) +
geom_line(aes(time, fishstock, group=interaction(reps,method), color=method), alpha=.1) +
scale_colour_manual(values=cbPalette, guide = guide_legend(override.aes = list(alpha = 1)))+
ggtitle(paste("seed", seed))
print(fish_plot)
harvest_plot <- ggplot(dt) +
geom_line(aes(time, harvest, group=interaction(reps,method), color=method), alpha=.1) +
scale_colour_manual(values=cbPalette, guide = guide_legend(override.aes = list(alpha = 1))) +
ggtitle(paste("seed", seed))
print(harvest_plot)
}
profits_stats <- function(dt){
profits <- dt[, sum(profit), by = c("reps", "method")]
means <- profits[, mean(V1), by = method]
sds <- profits[, sd(V1), by = method]
yield <- cbind(means, sd = sds$V1)
yield
}
gp_plot <- function(gp, f, p, f_alt, p_alt, x_grid, obs, seed){
tgp_dat <-
data.frame( x = gp$XX[[1]],
y = gp$ZZ.km,
ymin = gp$ZZ.km - 1.96 * sqrt(gp$ZZ.ks2),
ymax = gp$ZZ.km + 1.96 * sqrt(gp$ZZ.ks2))
true <- sapply(x_grid, f, 0, p)
est <- sapply(x_grid, f_alt, 0, p_alt)
models <- data.frame(x=x_grid, GP=tgp_dat$y, Parametric=est, True=true)
models <- melt(models, id="x")
names(models) <- c("x", "method", "value")
plot_gp <- ggplot(tgp_dat) + geom_ribbon(aes(x,y,ymin=ymin,ymax=ymax), fill="gray80") +
geom_line(data=models, aes(x, value, col=method), lwd=2, alpha=0.8) +
geom_point(data=obs, aes(x,y), alpha=0.8) +
xlab(expression(X[t])) + ylab(expression(X[t+1])) +
scale_colour_manual(values=cbPalette) +
ggtitle(paste("seed", seed))
print(plot_gp)
}
posteriors_plot <- function(gp, priors){
hyperparameters <- c("index", "s2", "tau2", "beta0", "nug", "d", "ldetK")
posteriors <- melt(gp$trace$XX[[1]][,hyperparameters], id="index")
prior_curves <- ddply(posteriors, "variable", function(dd){
grid <- seq(min(dd$value), max(dd$value), length = 100)
data.frame(value = grid, density = priors[[dd$variable[1]]](grid))
})
plot_posteriors <- ggplot(posteriors) +
#geom_density(aes(value), lwd=2) +
geom_histogram(aes(x=value, y=..density..), alpha=0.7) +
geom_line(data=prior_curves, aes(x=value, y=density), col="red", lwd=2) +
facet_wrap(~ variable, scale="free")
print(plot_posteriors)
}
require(snowfall)
sfInit(par=TRUE, cpu=8)
sfExportAll()
sfLibrary(pdgControl)
sfLibrary(nonparametricbayes)
sfLibrary(reshape2)
sfLibrary(ggplot2)
sfLibrary(data.table)
sfLibrary(tgp)
sfLibrary(kernlab)
sfLibrary(MCMCpack)
sfLibrary(plyr)
seed <- round(runif(32) * 1e6)
seed[1] <- 1
seed
[1] 1 969343 449127 263444 674131 949894 913719 444907 989690 229414
[11] 865064 804050 965462 777512 497134 65605 141485 193569 259734 451474
[21] 695013 530379 124241 497581 611219 718556 620409 26555 71806 717469
[31] 393034 540837
yields <- lapply(seed,
function(seed_i){
Xo <- allee + x_grid[10] # observations start from
x0 <- Xo # simulation under policy starts from
obs <- sim_obs(Xo, z_g, f, p, Tobs=40, seed = seed_i)
est <- par_est(obs)
gp <- bgp(X=obs$x, XX=x_grid, Z=obs$y, verb=0,
meanfn="constant", bprior="b0", BTE=c(2000,16000,2),
m0r1=FALSE, corr="exp", trace=FALSE,
beta = beta, s2.p = s2.p, d.p = d.p, nug.p = nug.p, tau2.p = tau2.p,
s2.lam = "fixed", d.lam = "fixed", nug.lam = "fixed", tau2.lam = "fixed")
gp_plot(gp, f, p, est$f_alt, est$p_alt, x_grid, obs, seed_i)
# posteriors_plot(gp, priors) # needs trace=TRUE!
OPT <- optimal_policy(gp, f, est$f_alt, p, est$p_alt, x_grid, h_grid, sigma_g, est$sigma_g_alt, delta, xT, profit, reward, OptTime)
dt <- simulate_opt(OPT, f, p, x_grid, h_grid, x0, z_g, profit)
sim_plots(dt, seed=seed_i)
profits_stats(dt)
})
yields <- melt(yields, id=c("method", "V1", "sd"))
ggplot(yields) + geom_histogram(aes(V1)) + facet_wrap(~method, scale='free')
stat_bin: binwidth defaulted to range/30. Use 'binwidth = x' to adjust
this.
stat_bin: binwidth defaulted to range/30. Use 'binwidth = x' to adjust
this.
stat_bin: binwidth defaulted to range/30. Use 'binwidth = x' to adjust
this.
yields
method V1 sd L1
1 GP 8.1300 1.69491 1
2 Parametric 2.4240 0.27111 1
3 True 7.8840 1.76601 1
4 GP 8.0174 1.67504 2
5 Parametric 2.6360 0.34841 2
6 True 7.8840 1.76601 2
7 GP 6.4140 1.44192 3
8 Parametric 0.5685 0.36637 3
9 True 7.8840 1.76601 3
10 GP 7.6080 1.55418 4
11 Parametric 0.1485 0.15739 4
12 True 7.8840 1.76601 4
13 GP 8.0955 1.69390 5
14 Parametric 0.0915 0.11850 5
15 True 7.8840 1.76601 5
16 GP 6.3000 0.00000 6
17 Parametric 2.7797 0.22161 6
18 True 7.8840 1.76601 6
19 GP 8.0745 1.66938 7
20 Parametric 2.5102 0.41036 7
21 True 7.8840 1.76601 7
22 GP 6.3000 0.00000 8
23 Parametric 2.8819 1.13615 8
24 True 7.8840 1.76601 8
25 GP 8.0775 1.66520 9
26 Parametric 0.5685 0.36637 9
27 True 7.8840 1.76601 9
28 GP 8.1225 1.69992 10
29 Parametric 2.7786 0.08342 10
30 True 7.8840 1.76601 10
31 GP 8.0759 1.66078 11
32 Parametric 2.5931 0.36977 11
33 True 7.8840 1.76601 11
34 GP 8.0835 1.72560 12
35 Parametric 6.9945 1.95619 12
36 True 7.8840 1.76601 12
37 GP 7.3545 1.49506 13
38 Parametric 2.3198 0.41146 13
39 True 7.8840 1.76601 13
40 GP 8.0775 1.66520 14
41 Parametric 2.5945 0.23523 14
42 True 7.8840 1.76601 14
43 GP 6.3000 0.00000 15
44 Parametric 0.5685 0.36637 15
45 True 7.8840 1.76601 15
46 GP 6.9930 1.46548 16
47 Parametric 2.5945 0.23523 16
48 True 7.8840 1.76601 16
49 GP 8.1120 1.69715 17
50 Parametric 2.3114 0.23917 17
51 True 7.8840 1.76601 17
52 GP 7.3200 1.51222 18
53 Parametric 2.6059 0.27427 18
54 True 7.8840 1.76601 18
55 GP 8.1180 1.69388 19
56 Parametric 0.5685 0.36637 19
57 True 7.8840 1.76601 19
58 GP 8.0220 1.74766 20
59 Parametric 5.5725 1.70885 20
60 True 7.8840 1.76601 20
61 GP 7.6080 1.55418 21
62 Parametric 3.1926 1.10508 21
63 True 7.8840 1.76601 21
64 GP 6.4695 1.43474 22
65 Parametric 2.3919 0.39680 22
66 True 7.8840 1.76601 22
67 GP 7.9830 1.63145 23
68 Parametric 2.2469 0.16183 23
69 True 7.8840 1.76601 23
70 GP 8.1285 1.69568 24
71 Parametric 2.6167 0.22072 24
72 True 7.8840 1.76601 24
73 GP 6.9960 1.46792 25
74 Parametric 2.4249 0.12660 25
75 True 7.8840 1.76601 25
76 GP 6.3000 0.00000 26
77 Parametric 3.1950 0.95032 26
78 True 7.8840 1.76601 26
79 GP 7.9830 1.63145 27
80 Parametric 2.5022 0.31409 27
81 True 7.8840 1.76601 27
82 GP 6.3000 0.00000 28
83 Parametric 2.3670 0.23987 28
84 True 7.8840 1.76601 28
85 GP 7.9830 1.63145 29
86 Parametric 2.5945 0.23523 29
87 True 7.8840 1.76601 29
88 GP 8.0175 1.75271 30
89 Parametric 2.8178 0.08035 30
90 True 7.8840 1.76601 30
91 GP 8.1285 1.69568 31
92 Parametric 2.5992 0.27697 31
93 True 7.8840 1.76601 31
94 GP 6.3000 0.00000 32
95 Parametric 0.0660 0.11144 32
96 True 7.8840 1.76601 32
NULL
R Package Documentation
Browse R Packages
We want your feedback!
Note that we can't provide technical support on individual packages. You should contact the package authors for that.
Embedding an R snippet on your website
Add the following code to your website.
For more information on customizing the embed code, read Embedding Snippets.