CircleLimitI: Circle Limit I by Mc Esher
In dewittpe/sccm: Schwarz-Christoffel Conformal Mapping
CircleLimitI R Documentation
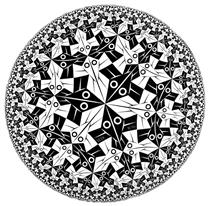
Circle Limit I by Mc Esher
Description
A dataset containing (x, y) coordinates (pixels) and shading level for
MC Escher's Circle Limit I
Usage
CircleLimitI
Format
A data frame
- pixel_x
x coordinate
- pixel_y
y coordinate
- value
shading value
- x
x coordinate scaled for the unit disk
- y
y coordinate scaled for the unit disk
Source
http://uploads4.wikiart.org/images/m-c-escher/circle-limit-i.jpg!PinterestSmall.jpg
Examples
data("CircleLimitI", package = "sccm")
summary(CircleLimitI)

## Not run:
ggplot2::ggplot(CircleLimitI) +
ggplot2::aes(x = x, y = y, fill = value) +
ggplot2::geom_tile() +
ggplot2::theme_bw() +
ggplot2::theme(legend.position = "none") +
ggplot2::coord_equal(ratio = 1)

## End(Not run)
dewittpe/sccm documentation built on Feb. 2, 2024, 5:25 p.m.
R Package Documentation
Browse R Packages
We want your feedback!
Note that we can't provide technical support on individual packages. You should contact the package authors for that.
| CircleLimitI | R Documentation |
Circle Limit I by Mc Esher
Description
A dataset containing (x, y) coordinates (pixels) and shading level for MC Escher's Circle Limit I
Usage
CircleLimitI
Format
A data frame
- pixel_x
x coordinate
- pixel_y
y coordinate
- value
shading value
- x
x coordinate scaled for the unit disk
- y
y coordinate scaled for the unit disk
Source
http://uploads4.wikiart.org/images/m-c-escher/circle-limit-i.jpg!PinterestSmall.jpg
Examples
data("CircleLimitI", package = "sccm")
summary(CircleLimitI)
## Not run:
ggplot2::ggplot(CircleLimitI) +
ggplot2::aes(x = x, y = y, fill = value) +
ggplot2::geom_tile() +
ggplot2::theme_bw() +
ggplot2::theme(legend.position = "none") +
ggplot2::coord_equal(ratio = 1)
## End(Not run)
R Package Documentation
Browse R Packages
We want your feedback!
Note that we can't provide technical support on individual packages. You should contact the package authors for that.
Embedding an R snippet on your website
Add the following code to your website.
For more information on customizing the embed code, read Embedding Snippets.