README.md
In dgiguer/omicplotR_pkg: Visual Exploration of Omic Datasets Using a Shiny App
omicplotR
An R package to visualize high-throughput sequencing data. Click on the wiki for more!

Read more about omicplotR here:
Table of content
Introduction
As input, omicplotR takes the following:
A data file and optionally a metadata file
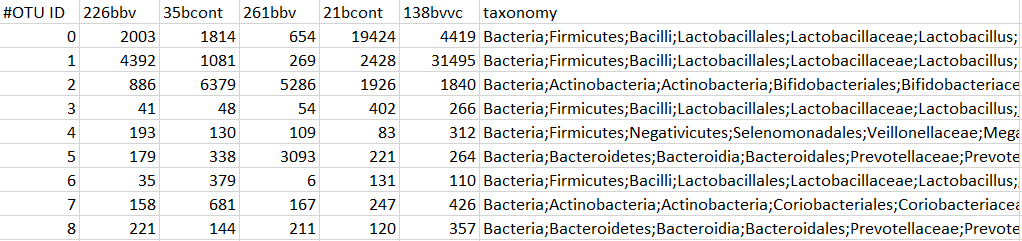
The data file is a count table of sequencing reads with samples as columns and features by rows
* An additional column of taxonomic identifiers may be included. Column name must be 'taxonomy', identifiers must contain at least 4 levels separated by a semi-colon (Bacteria;Firmicutes;Bacilli;Lactobacillales)
Here is an example of how your data file should look:
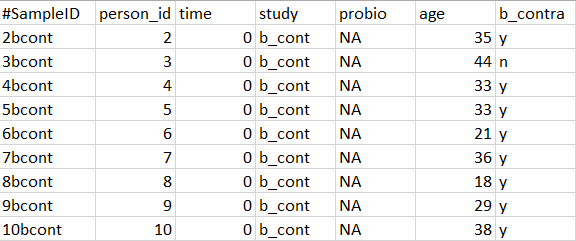
- The metadata file must contain samples by rows and identifiers by columns
Here is an example of how your metadata should look like:
Reasons to use omicplotR:
It allows you to explore your raw sequencing count data without coding in R
It performs interactive filtering
It allows you to easily colour PCA biplots according to metadata
It generates interactive effect plots
* It allows easy download of publically available data from the EBI MGnify portal
Reasons to not use omicplotR:
* You have thousands of samples and tens of thousands of features (it will be quicker using the command line)
Installation
The first thing to check is if you have the current version of Bioconductor. Look at the BiocManager vignette for instructions on installing or upgrading to 3.10.
You can check the version of Bioconductor that is install if you already have BiocManager installed.
BiocManager::version()
Once you have ensured that you have the correct version of Bioconductor, install omicplotR:
BiocManager::install("omicplotR")
The development version can be installed directly from Github:
install.packages("devtools")
devtools::install_github("dgiguer/omicplotR")
Quick usage
The quickest way to run omicplotR is:
library(omicplotR)
omicplotr.run()
This will pop up a window in your default browser.
To view the tutorials, visit the wiki.
Submit bug report
If omicplotR is not working as expected, please submit an issue that includes the following information. This will help me help you!
Please make sure to fill in this template when submitting an issue. Thank you for taking the time to submit an issue!
- [x] Please check off boxes below like this.

What is the error message that appears in the R console?

- [ ] Check that you are using the newest release of R.
- [ ] Check that you are using the newest release of omicplotR.

What OS are you on?

- [ ] Windows
- [ ] macOS
- [ ] Linux

What version of your OS are you on?

What is the expected behaviour?

What is the actual behaviour?

What does the error look like? (submit screenshot of browser if possible)
dgiguer/omicplotR_pkg documentation built on Nov. 18, 2019, 6:31 p.m.
R Package Documentation
Browse R Packages
We want your feedback!
Note that we can't provide technical support on individual packages. You should contact the package authors for that.
omicplotR
An R package to visualize high-throughput sequencing data. Click on the wiki for more!
![]()
Read more about omicplotR here:
Table of content
Introduction
As input, omicplotR takes the following: A data file and optionally a metadata file The data file is a count table of sequencing reads with samples as columns and features by rows * An additional column of taxonomic identifiers may be included. Column name must be 'taxonomy', identifiers must contain at least 4 levels separated by a semi-colon (Bacteria;Firmicutes;Bacilli;Lactobacillales)
Here is an example of how your data file should look:
- The metadata file must contain samples by rows and identifiers by columns
Here is an example of how your metadata should look like:
Reasons to use omicplotR: It allows you to explore your raw sequencing count data without coding in R It performs interactive filtering It allows you to easily colour PCA biplots according to metadata It generates interactive effect plots * It allows easy download of publically available data from the EBI MGnify portal
Reasons to not use omicplotR: * You have thousands of samples and tens of thousands of features (it will be quicker using the command line)
Installation
The first thing to check is if you have the current version of Bioconductor. Look at the BiocManager vignette for instructions on installing or upgrading to 3.10.
You can check the version of Bioconductor that is install if you already have BiocManager installed.
BiocManager::version()
Once you have ensured that you have the correct version of Bioconductor, install omicplotR:
BiocManager::install("omicplotR")
The development version can be installed directly from Github:
install.packages("devtools")
devtools::install_github("dgiguer/omicplotR")
Quick usage
The quickest way to run omicplotR is:
library(omicplotR)
omicplotr.run()
This will pop up a window in your default browser.
To view the tutorials, visit the wiki.
Submit bug report
If omicplotR is not working as expected, please submit an issue that includes the following information. This will help me help you!
Please make sure to fill in this template when submitting an issue. Thank you for taking the time to submit an issue!
- [x] Please check off boxes below like this.
What is the error message that appears in the R console?
- [ ] Check that you are using the newest release of R.
- [ ] Check that you are using the newest release of omicplotR.
What OS are you on?
- [ ] Windows
- [ ] macOS
- [ ] Linux
What version of your OS are you on?
What is the expected behaviour?
What is the actual behaviour?
What does the error look like? (submit screenshot of browser if possible)
R Package Documentation
Browse R Packages
We want your feedback!
Note that we can't provide technical support on individual packages. You should contact the package authors for that.
Embedding an R snippet on your website
Add the following code to your website.
For more information on customizing the embed code, read Embedding Snippets.