README.md
In kablag/shinyMolBio: Molecular Biology Visualization Tools for 'Shiny' Apps


shinyMolBio
Molecular biology visualization tools for Shiny apps
Manual
The manual is available online
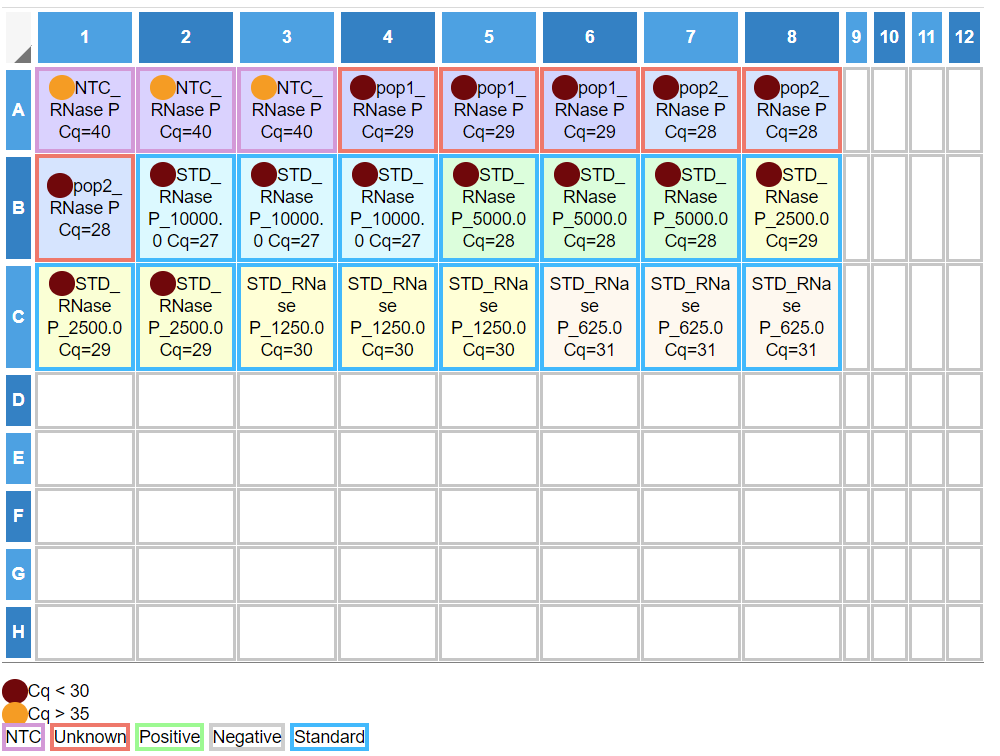
pcrPlateInput
Create an input control for representing PCR plate and dynamically selecting wells inside it.
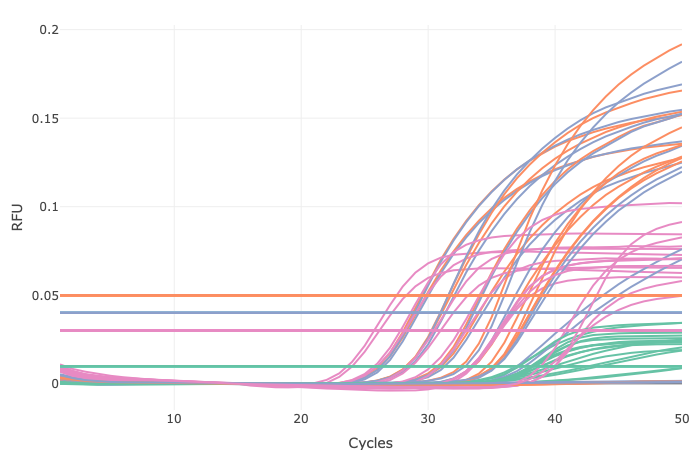
renderAmpCurves
Create a plot with the real-time PCR amplification curves.
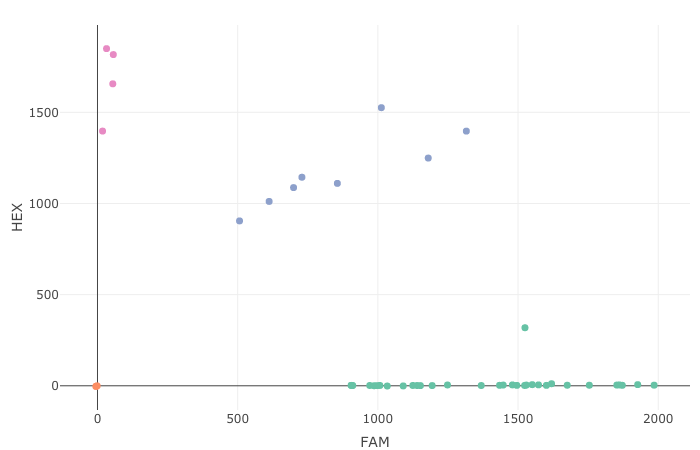
renderADplot
Create an allelic discrimination plot.
kablag/shinyMolBio documentation built on Nov. 8, 2024, 10:06 a.m.
R Package Documentation
Browse R Packages
We want your feedback!
Note that we can't provide technical support on individual packages. You should contact the package authors for that.
shinyMolBio
Molecular biology visualization tools for Shiny apps
Manual
The manual is available online
pcrPlateInput
Create an input control for representing PCR plate and dynamically selecting wells inside it.
renderAmpCurves
Create a plot with the real-time PCR amplification curves.
renderADplot
Create an allelic discrimination plot.
R Package Documentation
Browse R Packages
We want your feedback!
Note that we can't provide technical support on individual packages. You should contact the package authors for that.
Embedding an R snippet on your website
Add the following code to your website.
For more information on customizing the embed code, read Embedding Snippets.