In mchevalier2/crestr: A Probabilistic Approach to Reconstruct Past Climates Using Palaeoecological Datasets
knitr::opts_chunk$set(
  collapse = TRUE,
  comment = "#>",
  fig.path = "man/figures/README-",
  out.width = "100%",
  fig.cap=""
)
crestr An R package to perform probabilistic palaeoclimate reconstructions from palaeoecological datasets
crestr produces probabilistic reconstructions of past climate change from fossil assemblage data (Chevalier, 2022). crestr works by analysing how certain biological indicators (like plant or animal remains) respond to climate factors, using statistical methods to estimate these relationships. These relationships are mdelled as probability density functions (PDFs; see Chevalier et al. (2014) and Chevalier (2019)). The theory underpinning this package is explained in section A bit of theory and is illustrated with an application based on pseudo-data in section Get Started. The different vignettes present different aspects of the structure of the package and the data it contains, along with applications based on real data.
Why choose crestr? Unlike traditional methods, crestr uses probabilistic techniques to provide more accurate and flexible climate reconstructions. Its focus on accessibility means you don’t need to be an expert coder to get meaningful results.
NOTE: While active development of crestr has concluded, its robust features will continue to provide valuable insights for palaeoclimate research. The available documentation and resources will remain accessible for independent use. In addition, I am committed to maintaining this bug-free. As such, please reach out at paleo@manuelchevalier.com if you encounter technical issues.
Installation
Ready to explore the climate history hidden in your data? Install crestr now and leverage its robust tools for your research.
The package is available from GitHub and can be installed as follow:
if(!require(devtools)) install.packages("devtools")
devtools::install_github("mchevalier2/crestr")
crestr in a nutshell
Key advantages of crestr:
- Probabilistic climate reconstruction ensures reliable and flexible outcomes.
- Adaptable to diverse datasets, from pollen to marine microfossils.
- Generation of clear and engaging representations of probabilistic results.
- Validated by its application in many peer-reviewed studies (see below).
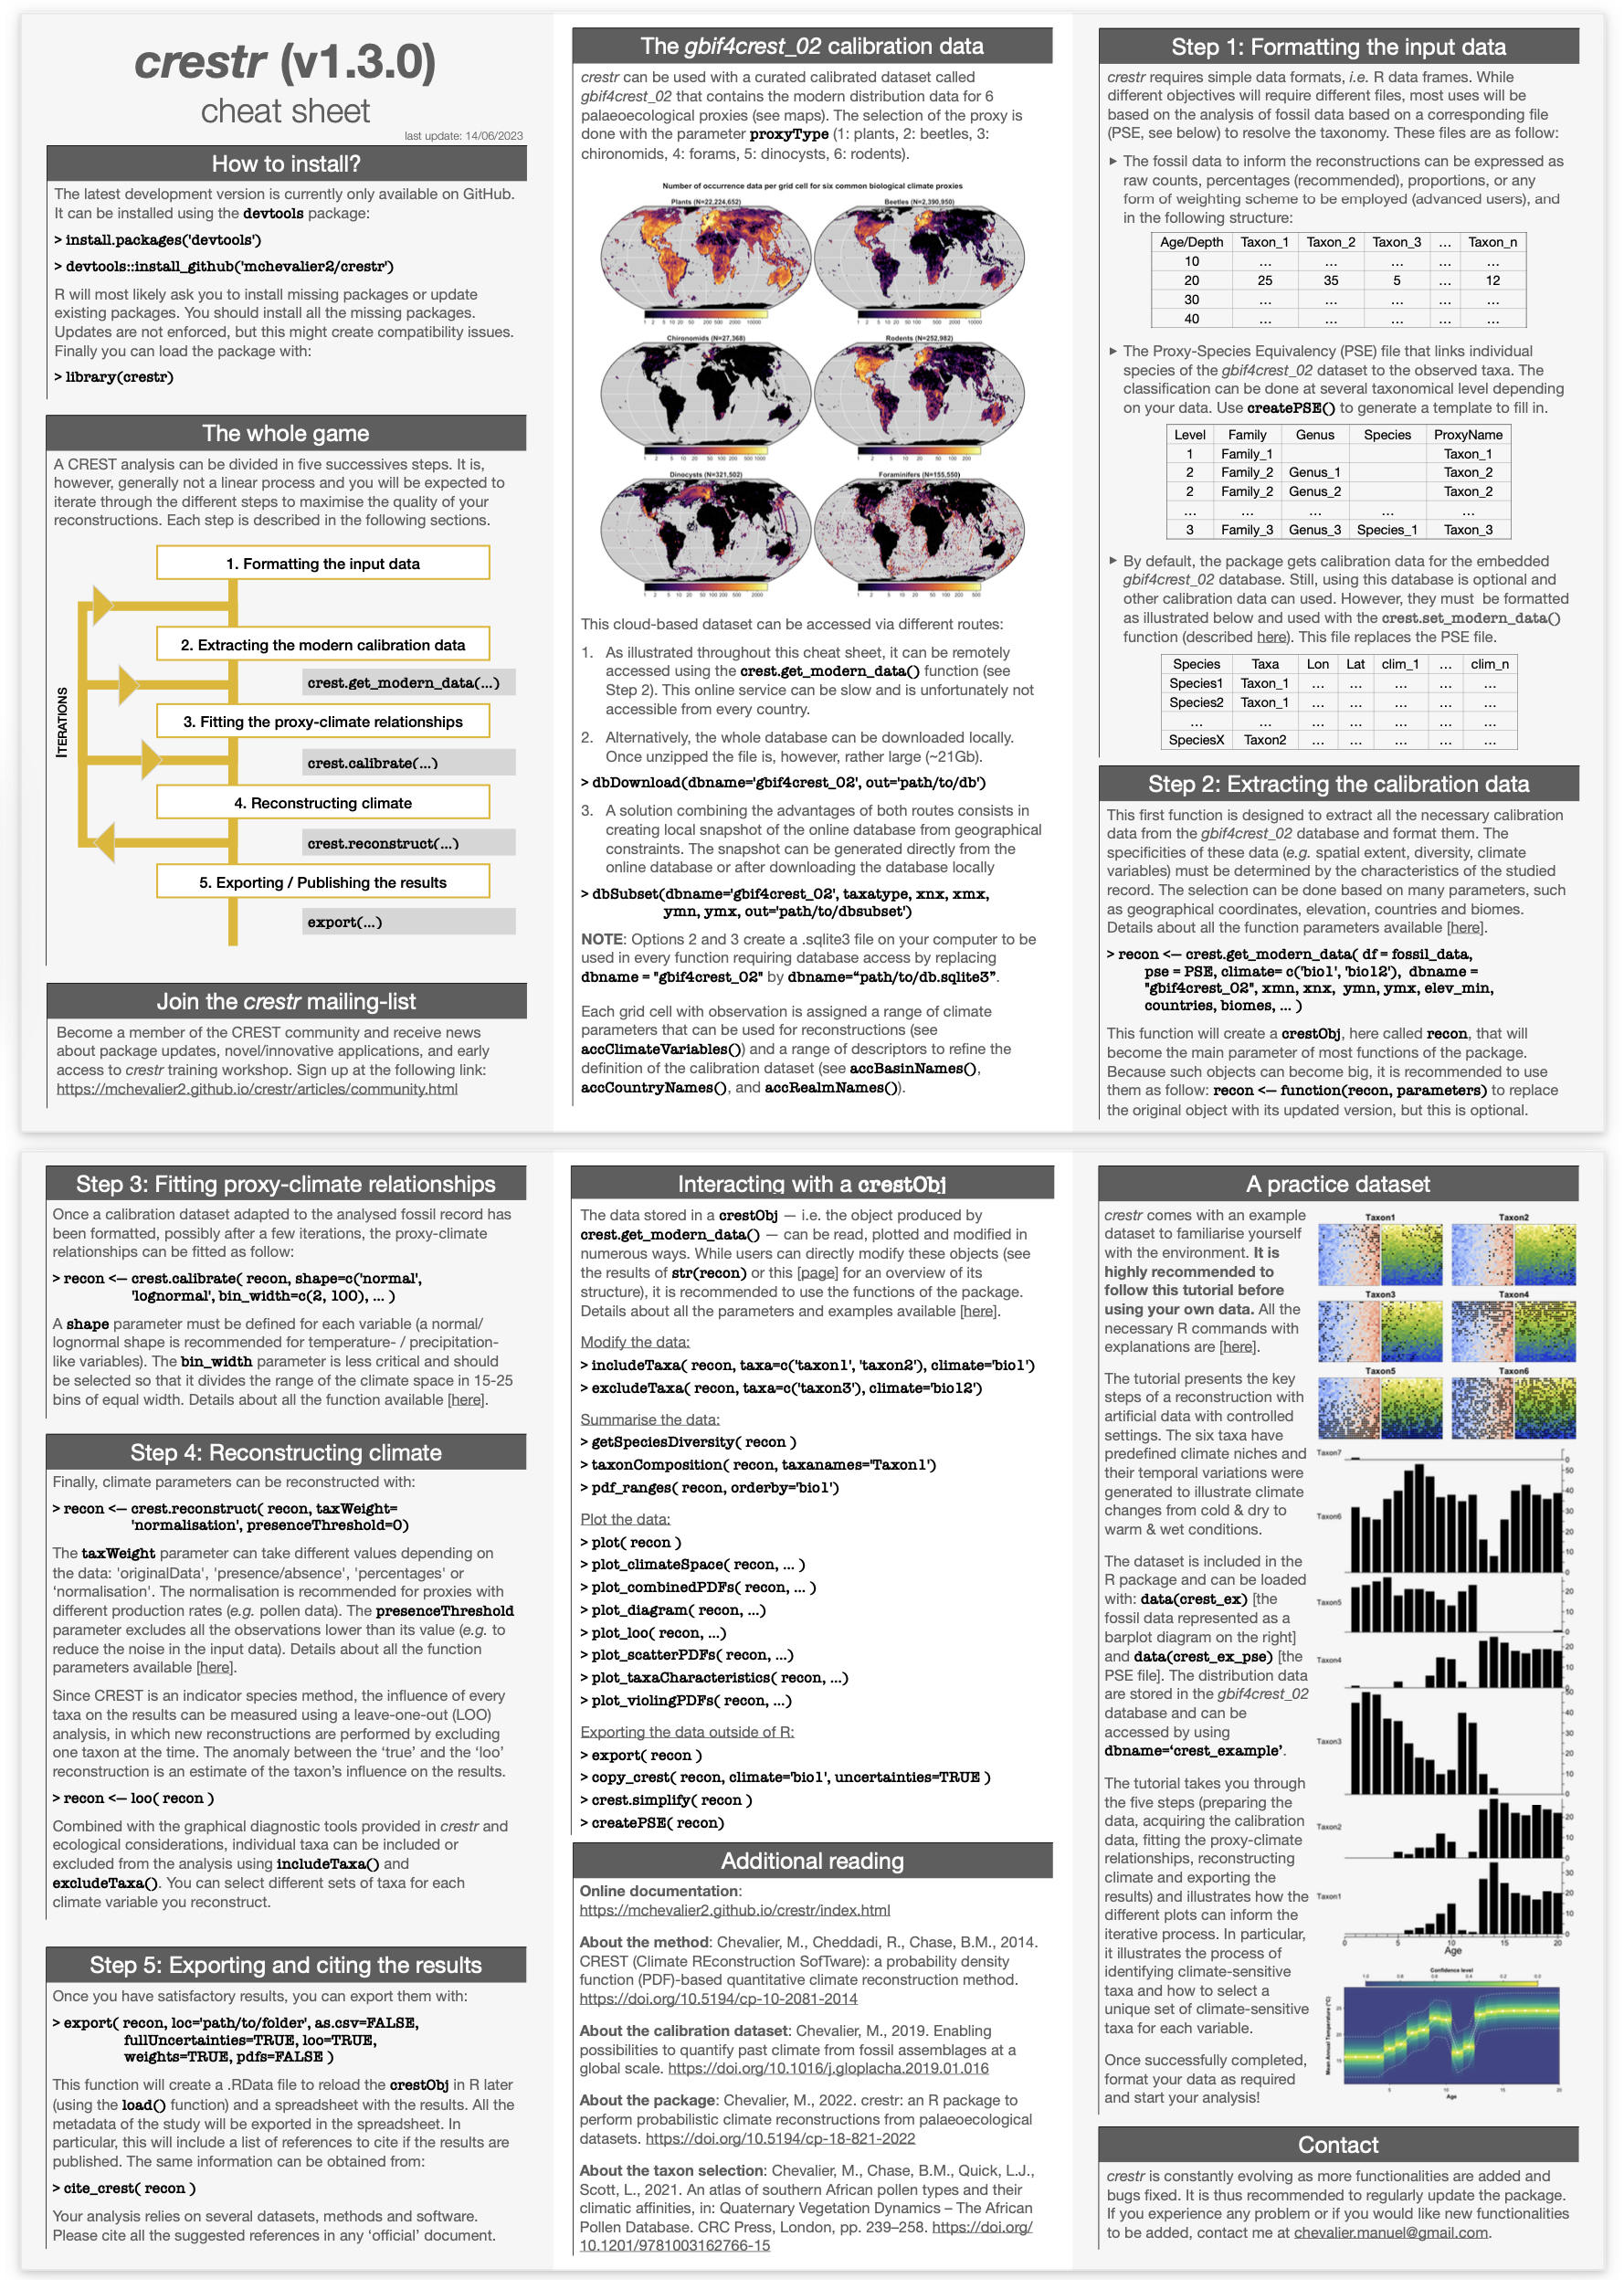
To get started, refer to the crestr cheat sheet, which provides step-by-step guidance on using the package. This document summarises the main functionalities of the package and illustrates the main key step you will have to follow to reconstruct environmental parameters from your data. [download here]
`
Example applications
knitr::include_graphics("https://raw.githubusercontent.com/mchevalier2/crestr/master/webpage/example-app.png")
Real-world examples of how crestr has been used. (A) density of presence records available in the gbif4crest_02 calibration dataset upscaled at a 1° resolution. The diamonds represent the location of the pollen records used to generate the reconstructions presented in B-D, and the coloured boxes represent the extent of their respective calibration zones. (B) Lake Van, Turkey: Reconstructed annual rainfall patterns (Chevalier, 2019), (C) Laguna Fùquene, Colombia: Estimated average yearly temperatures. (unpublished) and (D) Marine Core MD96-2048 (off southeastern Africa): 800,000 year-long temperature changes in marine environments (Chevalier et al., 2021).
CREST in the scientific literature
knitr::include_graphics("https://raw.githubusercontent.com/mchevalier2/crestr/master/webpage/crest-use-02.png")
Location of real_world crest-based climate reconstructions. All these examples showcase CREST’s ability to contribute to global climate research and advance our understanding of regional environmental changes.
- 2024
- Trasune, L., Väliranta, M., Stivrins, N., Amon, L., Schenk, F., Salonen, J.S., 2024. A comparison of plant macrofossil-based quantitative climate reconstruction methods: A case study of the lateglacial Baltic States. Quaternary Science Reviews 338, 108811. https://doi.org/10.1016/j.quascirev.2024.108811
- McCoy, J., Gibson, M.E., Hocking, E.P., O’Keefe, J.M.K., Riding, J.B., Roberts, R., Campbell, S., Abbott, G.D., Pound, M.J., 2024. Temperate to tropical palaeoclimates on the northwest margin of Europe during the middle Cenozoic. Palaeontol Electron. https://doi.org/10.26879/1349
- O’Keefe, J.M.K., Pound, M.J., Romero, I.C., Nuñez Otaño, N.B., Gibson, M.E., McCoy, J., Alden, M.E., Fairchild, C.J., Fitzpatrick, J., Hodgson, E., Horsfall, T., Jones, S., Lennex-Stone, J.E., Marsh, C.A., Patel, A.A., Spears, T.M., Tarlton, L., Smallwood, L.F., VanderEspt, O.L., Cabrera, J.R., Eble, C.F., Rember, W.C., Starnes, J.E., Alford, M.H., Brink, A., Warny, S., 2024. Summer-Wet Hydrologic Cycle during the Middle Miocene of the United States: New Evidence from Fossil Fungi. Research 7, 0481. https://doi.org/10.34133/research.0481
- 2023
- Pilie, M., Gibson, M.E., Romero, I.C., Nuñez Otaño, N.B., Pound, M.J., O’Keefe, J.M.K., Warny, S., 2023. Miocene Climatic Optimum fungal record and plant-based CREST climatic reconstruction from southern McMurdo Sound, Antarctica. J. Micropalaeontol. 42, 291–307. https://doi.org/10.5194/jm-42-291-2023
- Hui, Z., Wei, X., Xue, Z., Zhao, X., Chevalier, M., Lu, X., Zhang, J., Peng, T., Chen, Y., Chen, P., 2023,Middle Miocene Evolution of East Asian Summer Monsoon Precipitation in the Northeast Part of the Tibetan Plateau Based on a Quantitative Analysis of Palynological Records. Palaeogeography, Palaeoclimatology, Palaeoecology, pp 111808. 10.1016/j.palaeo.2023.111808.
- Hui, Z., Liu, J., Chevalier, M., Wei, X., Chen, P., Zhan, J., Peng, T., Zhou, X., 2023, Multiple forcing on Late Miocene East Asian Summer Monsoon Precipitation Variability in NE Tibetan Plateau. CATENA 221, 106752. 10.1016/j.catena.2022.106752.
- 2022
- Gibson, M.E., McCoy, J., O’Keefe, J.M.K., Nuñez Otaño, N.B., Warny, S., Pound, M.J., 2022, Reconstructing Terrestrial Paleoclimates: A Comparison of the Co‐Existence Approach, Bayesian and Probability Reconstruction Techniques Using the UK Neogene. Paleoceanog. and Paleoclimatol. 37, e2021PA004358. 10.1029/2021PA004358
- 2021
- Chevalier, M., Chase, B.M., Quick, L.J., Dupont, L.M. and Johnson, T.C., 2021, Temperature change in subtropical southeastern Africa during the past 790,000 yr. Geology, 49, pp. 71–75. 10.1016/j.palaeo.2021.110609
- Hui, Z., Zhou, X., Chevalier, M., Wei, X., Pan, Y. and Chen, Y., 2021, Miocene East Asia summer monsoon precipitation variability and its possible driving forces. Palaeogeography, Palaeoclimatology, Palaeoecology, pp. 110609. 10.1130/G47841.1
- Quick, L.J., Chase, B.M., Carr, A.S., Chevalier, M., Grobler, B.A. and Meadows, M.E., 2021, A 25,000 year record of climate and vegetation change from the southwestern Cape coast, South Africa. Quaternary Research, pp. 1–18. 10.1017/qua.2021.31
- Romero, I. C., Nuñez Otaño, N. B., Gibson, M. E., Spears, T. M., Fairchild, C. J., Tarlton, L., Jones, S., Belkin, H. E., Warny, S., Pound, M. J. and O’Keefe, J. M. K., 2021, First Record of Fungal Diversity in the Tropical and Warm-Temperate Middle Miocene Climate Optimum Forests of Eurasia, Frontiers in Forests and Global Change, 1–18. 10.3389/ffgc.2021.768405
- 2020
- Yi, S., Jun, C.P., Jo, K. nam, Lee, H., Kim, M.S., Lee, S.D., Cao, X. and Lim, J., 2020, Asynchronous multi-decadal time-scale series of biotic and abiotic responses to precipitation during the last 1300 years. Scientific Reports, 10, pp. 1–10. 10.1038/s41598-020-74994-x
- 2019
- Chevalier, M., 2019, Enabling possibilities to quantify past climate from fossil assemblages at a global scale. Global and Planetary Change, 175, pp. 27–35. 10.1016/j.gloplacha.2019.01.016
- 2017
- Cordova, C.E., Scott, L., Chase, B.M. and Chevalier, M., 2017, Late Pleistocene-Holocene vegetation and climate change in the Middle Kalahari, Lake Ngami, Botswana. Quaternary Science Reviews, 171, pp. 199–215. 10.1016/j.quascirev.2017.06.036
- 2016
- Lim, S., Chase, B.M., Chevalier, M. and Reimer, P.J., 2016, 50,000 years of climate in the Namib Desert, Pella, South Africa. Palaeogeography, Palaeoclimatology, Palaeoecology, 451, pp. 197–209. 10.1016/j.palaeo.2016.03.001
- Chevalier, M. and Chase, B.M., 2016, Determining the drivers of long-term aridity variability: a southern African case study. Journal of Quaternary Science, 31, pp. 143–151. 10.1002/jqs.2850
- 2015
- Chase, B.M., Lim, S., Chevalier, M., Boom, A., Carr, A.S., Meadows, M.E. and Reimer, P.J., 2015, Influence of tropical easterlies in the southwestern Cape of Africa during the Holocene. Quaternary Science Reviews, 107, pp. 138–148.10.1016/j.quascirev.2014.10.011
- Chase, B.M., Boom, A., Carr, A.S., Carré, M., Chevalier, M., Meadows, M.E., Pedro, J.B., Stager, J.C. and Reimer, P.J., 2015, Evolving southwest African response to abrupt deglacial North Atlantic climate change events. Quaternary Science Reviews, 121, pp. 132–136. 10.1016/j.quascirev.2015.05.023
- Chevalier, M. and Chase, B.M., 2015, Southeast African records reveal a coherent shift from high- to low-latitude forcing mechanisms along the east African margin across last glacial–interglacial transition. Quaternary Science Reviews, 125, pp. 117–130. 10.1016/j.quascirev.2015.07.009
- 2013
- Truc, L., Chevalier, M., Favier, C., Cheddadi, R., Meadows, M.E., Scott, L., Carr, A.S., Smith, G.F. and Chase, B.M., 2013, Quantification of climate change for the last 20,000 years from Wonderkrater, South Africa: implications for the long-term dynamics of the Intertropical Convergence Zone. Palaeogeography, Palaeoclimatology, Palaeoecology, 386, pp. 575–587. 10.1016/j.palaeo
knitr::include_graphics("https://raw.githubusercontent.com/mchevalier2/crestr/master/webpage/crest-use-01.png")
knitr::include_graphics("https://raw.githubusercontent.com/mchevalier2/crestr/master/webpage/crest-use-03.png")
Last update: 03/01/2025
N.B.: This list is as exhaustive as possible, but some studies may be missing. Contact me if you want your study to be added.
References
- Chevalier, M., Cheddadi, R., Chase, B.M., 2014. CREST (Climate REconstruction
SofTware): a probability density function (PDF)-based quantitative climate
reconstruction method. Clim. Past 10, 2081–2098.
10.5194/cp-10-2081-2014
- Chevalier, M., 2019. Enabling possibilities to quantify past climate from
fossil assemblages at a global scale. Glob. Planet. Change 175, 27–35.
10.1016/j.gloplacha.2019.01.016
- Chevalier, M., Chase, B.M., Quick, L.J., Dupont, L.M. and Johnson, T.C., 2021.
Temperature change in subtropical southeastern Africa during the past 790,000 yr.
Geology 49, 71–75. 10.1130/G47841.1
- Chevalier, M., 2022. crestr an R package to perform probabilistic climate
reconstructions from palaeoecological datasets. Clim. Past
doi:10.5194/cp-18-821-2022
mchevalier2/crestr documentation built on Feb. 14, 2025, 6:31 p.m.
R Package Documentation
Browse R Packages
We want your feedback!
Note that we can't provide technical support on individual packages. You should contact the package authors for that.
knitr::opts_chunk$set( collapse = TRUE, comment = "#>", fig.path = "man/figures/README-", out.width = "100%", fig.cap="" )
crestr An R package to perform probabilistic palaeoclimate reconstructions from palaeoecological datasets
crestr produces probabilistic reconstructions of past climate change from fossil assemblage data (Chevalier, 2022). crestr works by analysing how certain biological indicators (like plant or animal remains) respond to climate factors, using statistical methods to estimate these relationships. These relationships are mdelled as probability density functions (PDFs; see Chevalier et al. (2014) and Chevalier (2019)). The theory underpinning this package is explained in section A bit of theory and is illustrated with an application based on pseudo-data in section Get Started. The different vignettes present different aspects of the structure of the package and the data it contains, along with applications based on real data.
Why choose crestr? Unlike traditional methods, crestr uses probabilistic techniques to provide more accurate and flexible climate reconstructions. Its focus on accessibility means you don’t need to be an expert coder to get meaningful results.
NOTE: While active development of crestr has concluded, its robust features will continue to provide valuable insights for palaeoclimate research. The available documentation and resources will remain accessible for independent use. In addition, I am committed to maintaining this bug-free. As such, please reach out at paleo@manuelchevalier.com if you encounter technical issues.
Installation
Ready to explore the climate history hidden in your data? Install crestr now and leverage its robust tools for your research.
The package is available from GitHub and can be installed as follow:
if(!require(devtools)) install.packages("devtools") devtools::install_github("mchevalier2/crestr")
crestr in a nutshell
Key advantages of crestr:
- Probabilistic climate reconstruction ensures reliable and flexible outcomes.
- Adaptable to diverse datasets, from pollen to marine microfossils.
- Generation of clear and engaging representations of probabilistic results.
- Validated by its application in many peer-reviewed studies (see below).
To get started, refer to the crestr cheat sheet, which provides step-by-step guidance on using the package. This document summarises the main functionalities of the package and illustrates the main key step you will have to follow to reconstruct environmental parameters from your data. [download here]
`
Example applications
knitr::include_graphics("https://raw.githubusercontent.com/mchevalier2/crestr/master/webpage/example-app.png")
Real-world examples of how crestr has been used. (A) density of presence records available in the gbif4crest_02 calibration dataset upscaled at a 1° resolution. The diamonds represent the location of the pollen records used to generate the reconstructions presented in B-D, and the coloured boxes represent the extent of their respective calibration zones. (B) Lake Van, Turkey: Reconstructed annual rainfall patterns (Chevalier, 2019), (C) Laguna Fùquene, Colombia: Estimated average yearly temperatures. (unpublished) and (D) Marine Core MD96-2048 (off southeastern Africa): 800,000 year-long temperature changes in marine environments (Chevalier et al., 2021).
CREST in the scientific literature
knitr::include_graphics("https://raw.githubusercontent.com/mchevalier2/crestr/master/webpage/crest-use-02.png")
Location of real_world crest-based climate reconstructions. All these examples showcase CREST’s ability to contribute to global climate research and advance our understanding of regional environmental changes.
- 2024
- Trasune, L., Väliranta, M., Stivrins, N., Amon, L., Schenk, F., Salonen, J.S., 2024. A comparison of plant macrofossil-based quantitative climate reconstruction methods: A case study of the lateglacial Baltic States. Quaternary Science Reviews 338, 108811. https://doi.org/10.1016/j.quascirev.2024.108811
- McCoy, J., Gibson, M.E., Hocking, E.P., O’Keefe, J.M.K., Riding, J.B., Roberts, R., Campbell, S., Abbott, G.D., Pound, M.J., 2024. Temperate to tropical palaeoclimates on the northwest margin of Europe during the middle Cenozoic. Palaeontol Electron. https://doi.org/10.26879/1349
- O’Keefe, J.M.K., Pound, M.J., Romero, I.C., Nuñez Otaño, N.B., Gibson, M.E., McCoy, J., Alden, M.E., Fairchild, C.J., Fitzpatrick, J., Hodgson, E., Horsfall, T., Jones, S., Lennex-Stone, J.E., Marsh, C.A., Patel, A.A., Spears, T.M., Tarlton, L., Smallwood, L.F., VanderEspt, O.L., Cabrera, J.R., Eble, C.F., Rember, W.C., Starnes, J.E., Alford, M.H., Brink, A., Warny, S., 2024. Summer-Wet Hydrologic Cycle during the Middle Miocene of the United States: New Evidence from Fossil Fungi. Research 7, 0481. https://doi.org/10.34133/research.0481
- 2023
- Pilie, M., Gibson, M.E., Romero, I.C., Nuñez Otaño, N.B., Pound, M.J., O’Keefe, J.M.K., Warny, S., 2023. Miocene Climatic Optimum fungal record and plant-based CREST climatic reconstruction from southern McMurdo Sound, Antarctica. J. Micropalaeontol. 42, 291–307. https://doi.org/10.5194/jm-42-291-2023
- Hui, Z., Wei, X., Xue, Z., Zhao, X., Chevalier, M., Lu, X., Zhang, J., Peng, T., Chen, Y., Chen, P., 2023,Middle Miocene Evolution of East Asian Summer Monsoon Precipitation in the Northeast Part of the Tibetan Plateau Based on a Quantitative Analysis of Palynological Records. Palaeogeography, Palaeoclimatology, Palaeoecology, pp 111808. 10.1016/j.palaeo.2023.111808.
- Hui, Z., Liu, J., Chevalier, M., Wei, X., Chen, P., Zhan, J., Peng, T., Zhou, X., 2023, Multiple forcing on Late Miocene East Asian Summer Monsoon Precipitation Variability in NE Tibetan Plateau. CATENA 221, 106752. 10.1016/j.catena.2022.106752.
- 2022
- Gibson, M.E., McCoy, J., O’Keefe, J.M.K., Nuñez Otaño, N.B., Warny, S., Pound, M.J., 2022, Reconstructing Terrestrial Paleoclimates: A Comparison of the Co‐Existence Approach, Bayesian and Probability Reconstruction Techniques Using the UK Neogene. Paleoceanog. and Paleoclimatol. 37, e2021PA004358. 10.1029/2021PA004358
- 2021
- Chevalier, M., Chase, B.M., Quick, L.J., Dupont, L.M. and Johnson, T.C., 2021, Temperature change in subtropical southeastern Africa during the past 790,000 yr. Geology, 49, pp. 71–75. 10.1016/j.palaeo.2021.110609
- Hui, Z., Zhou, X., Chevalier, M., Wei, X., Pan, Y. and Chen, Y., 2021, Miocene East Asia summer monsoon precipitation variability and its possible driving forces. Palaeogeography, Palaeoclimatology, Palaeoecology, pp. 110609. 10.1130/G47841.1
- Quick, L.J., Chase, B.M., Carr, A.S., Chevalier, M., Grobler, B.A. and Meadows, M.E., 2021, A 25,000 year record of climate and vegetation change from the southwestern Cape coast, South Africa. Quaternary Research, pp. 1–18. 10.1017/qua.2021.31
- Romero, I. C., Nuñez Otaño, N. B., Gibson, M. E., Spears, T. M., Fairchild, C. J., Tarlton, L., Jones, S., Belkin, H. E., Warny, S., Pound, M. J. and O’Keefe, J. M. K., 2021, First Record of Fungal Diversity in the Tropical and Warm-Temperate Middle Miocene Climate Optimum Forests of Eurasia, Frontiers in Forests and Global Change, 1–18. 10.3389/ffgc.2021.768405
- 2020
- Yi, S., Jun, C.P., Jo, K. nam, Lee, H., Kim, M.S., Lee, S.D., Cao, X. and Lim, J., 2020, Asynchronous multi-decadal time-scale series of biotic and abiotic responses to precipitation during the last 1300 years. Scientific Reports, 10, pp. 1–10. 10.1038/s41598-020-74994-x
- 2019
- Chevalier, M., 2019, Enabling possibilities to quantify past climate from fossil assemblages at a global scale. Global and Planetary Change, 175, pp. 27–35. 10.1016/j.gloplacha.2019.01.016
- 2017
- Cordova, C.E., Scott, L., Chase, B.M. and Chevalier, M., 2017, Late Pleistocene-Holocene vegetation and climate change in the Middle Kalahari, Lake Ngami, Botswana. Quaternary Science Reviews, 171, pp. 199–215. 10.1016/j.quascirev.2017.06.036
- 2016
- Lim, S., Chase, B.M., Chevalier, M. and Reimer, P.J., 2016, 50,000 years of climate in the Namib Desert, Pella, South Africa. Palaeogeography, Palaeoclimatology, Palaeoecology, 451, pp. 197–209. 10.1016/j.palaeo.2016.03.001
- Chevalier, M. and Chase, B.M., 2016, Determining the drivers of long-term aridity variability: a southern African case study. Journal of Quaternary Science, 31, pp. 143–151. 10.1002/jqs.2850
- 2015
- Chase, B.M., Lim, S., Chevalier, M., Boom, A., Carr, A.S., Meadows, M.E. and Reimer, P.J., 2015, Influence of tropical easterlies in the southwestern Cape of Africa during the Holocene. Quaternary Science Reviews, 107, pp. 138–148.10.1016/j.quascirev.2014.10.011
- Chase, B.M., Boom, A., Carr, A.S., Carré, M., Chevalier, M., Meadows, M.E., Pedro, J.B., Stager, J.C. and Reimer, P.J., 2015, Evolving southwest African response to abrupt deglacial North Atlantic climate change events. Quaternary Science Reviews, 121, pp. 132–136. 10.1016/j.quascirev.2015.05.023
- Chevalier, M. and Chase, B.M., 2015, Southeast African records reveal a coherent shift from high- to low-latitude forcing mechanisms along the east African margin across last glacial–interglacial transition. Quaternary Science Reviews, 125, pp. 117–130. 10.1016/j.quascirev.2015.07.009
- 2013
- Truc, L., Chevalier, M., Favier, C., Cheddadi, R., Meadows, M.E., Scott, L., Carr, A.S., Smith, G.F. and Chase, B.M., 2013, Quantification of climate change for the last 20,000 years from Wonderkrater, South Africa: implications for the long-term dynamics of the Intertropical Convergence Zone. Palaeogeography, Palaeoclimatology, Palaeoecology, 386, pp. 575–587. 10.1016/j.palaeo
knitr::include_graphics("https://raw.githubusercontent.com/mchevalier2/crestr/master/webpage/crest-use-01.png")
knitr::include_graphics("https://raw.githubusercontent.com/mchevalier2/crestr/master/webpage/crest-use-03.png")
Last update: 03/01/2025
N.B.: This list is as exhaustive as possible, but some studies may be missing. Contact me if you want your study to be added.
References
- Chevalier, M., Cheddadi, R., Chase, B.M., 2014. CREST (Climate REconstruction SofTware): a probability density function (PDF)-based quantitative climate reconstruction method. Clim. Past 10, 2081–2098. 10.5194/cp-10-2081-2014
- Chevalier, M., 2019. Enabling possibilities to quantify past climate from fossil assemblages at a global scale. Glob. Planet. Change 175, 27–35. 10.1016/j.gloplacha.2019.01.016
- Chevalier, M., Chase, B.M., Quick, L.J., Dupont, L.M. and Johnson, T.C., 2021. Temperature change in subtropical southeastern Africa during the past 790,000 yr. Geology 49, 71–75. 10.1130/G47841.1
- Chevalier, M., 2022. crestr an R package to perform probabilistic climate reconstructions from palaeoecological datasets. Clim. Past doi:10.5194/cp-18-821-2022
R Package Documentation
Browse R Packages
We want your feedback!
Note that we can't provide technical support on individual packages. You should contact the package authors for that.
Embedding an R snippet on your website
Add the following code to your website.
For more information on customizing the embed code, read Embedding Snippets.