README.md
In milescsmith/seuratPlotly: Plotly-based methods for displaying Seurat data
SeuratPlotly
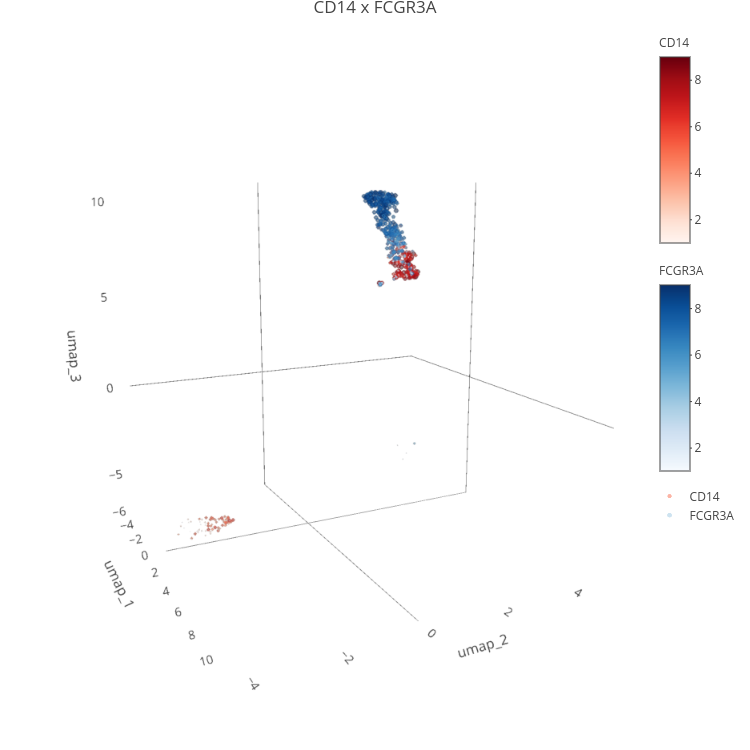
Plot_ly-based functions that are enhanced counterparts to the plotting functions available in the Seurat package. The primary advantage SeuratPlotly has over the standard plotting functions of Seurat are the inclusion of 3D scatterplots of dimentional reductions. For example, DimPlotly3D allows viewing the first 3 UMAP dimensions of of the
Villani dataset
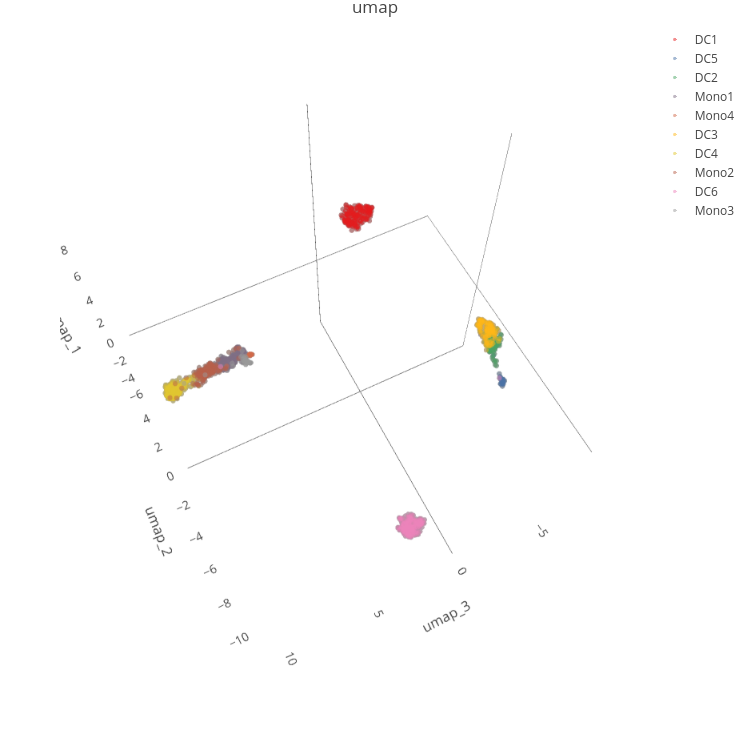
(click to interact with the plot) whereas FeaturePlotly3D and Feature2Plotly3D allow for viewing the expression of given features (in this case CD14 and CD16) in 3 dimensions:
milescsmith/seuratPlotly documentation built on June 4, 2019, 2:23 p.m.
R Package Documentation
Browse R Packages
We want your feedback!
Note that we can't provide technical support on individual packages. You should contact the package authors for that.
SeuratPlotly
Plot_ly-based functions that are enhanced counterparts to the plotting functions available in the Seurat package. The primary advantage SeuratPlotly has over the standard plotting functions of Seurat are the inclusion of 3D scatterplots of dimentional reductions. For example, DimPlotly3D allows viewing the first 3 UMAP dimensions of of the Villani dataset
(click to interact with the plot) whereas FeaturePlotly3D and Feature2Plotly3D allow for viewing the expression of given features (in this case CD14 and CD16) in 3 dimensions:
R Package Documentation
Browse R Packages
We want your feedback!
Note that we can't provide technical support on individual packages. You should contact the package authors for that.
Embedding an R snippet on your website
Add the following code to your website.
For more information on customizing the embed code, read Embedding Snippets.