README.md
In noriakis/CBNplot: plot bayesian network inferred from gene expression data based on enrichment analysis results
CBNplot: Bayesian network plot for the enrichment analysis results

Plot bayesian network inferred from expression data based on the enrichment analysis results from libraries including clusterProfiler and ReactomePA using bnlearn.
Installation
BiocManager::install("CBNplot")
library(devtools)
install_github("noriakis/CBNplot")
Usage
- Documentation: https://noriakis.github.io/software/CBNplot/
- Web server: ~~https://cbnplot.com~~
- Currently moving to the new server (2024/04/07)
Plot examples
-
The gene-to-gene relationship compared with the reference network.

-
The plot is customizable highliting edges and nodes like hub genes.
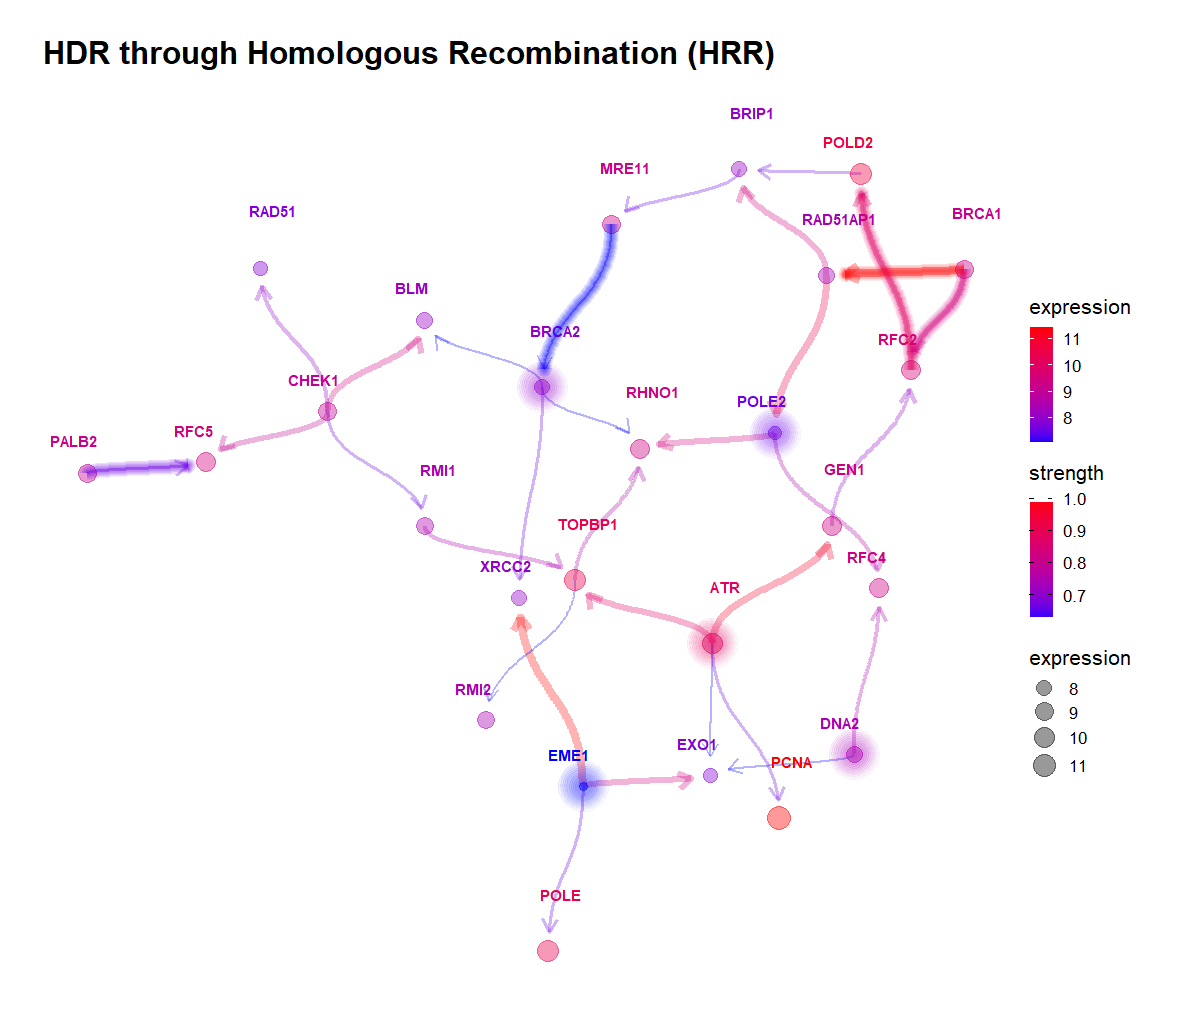
-
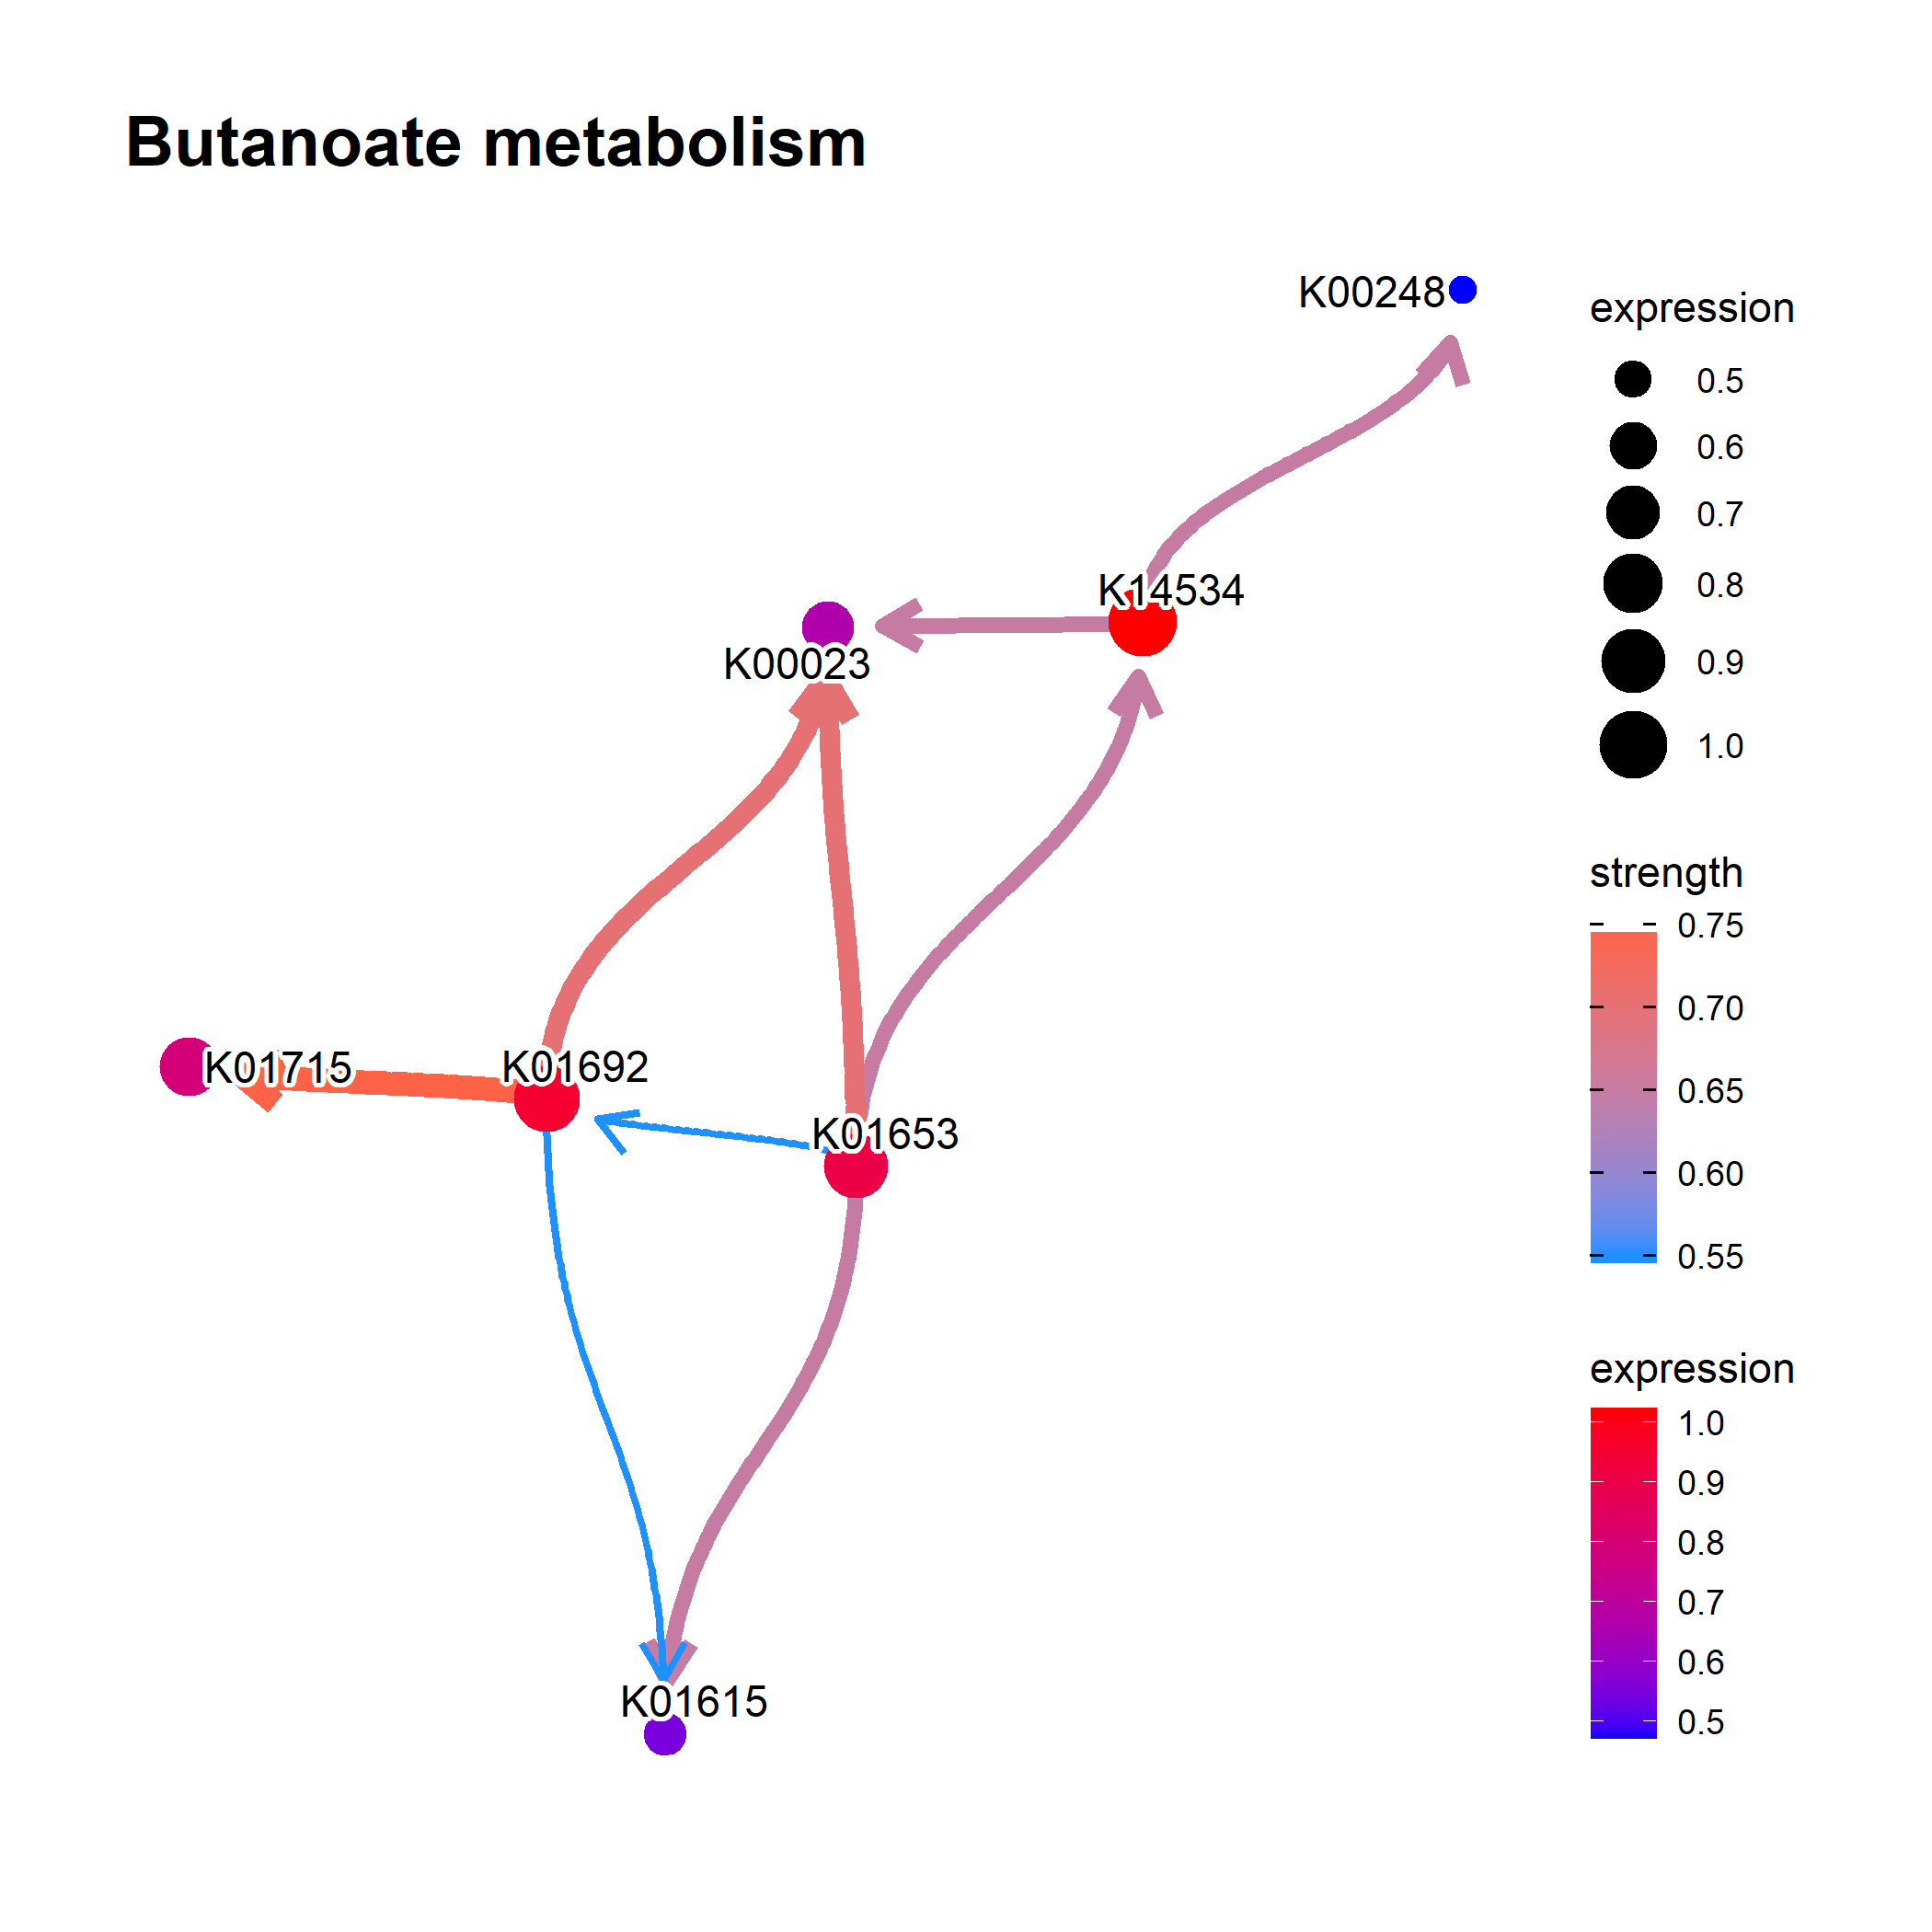
The example using MicrobiomeProfiler, thanks to the fix by @xiangpin.
library(MicrobiomeProfiler)
data(Rat_data)
ko.res <- enrichKO(Rat_data)
exp.dat <- matrix(abs(rnorm(910)), 91, 10) %>% magrittr::set_rownames(value=Rat_data) %>% magrittr::set_colnames(value=paste0('S', seq_len(ncol(.))))
exp.dat %>% head
library(CBNplot)
bngeneplot(ko.res, exp=exp.dat, pathNum=1, orgDb=NULL)
- Another customized plot.

noriakis/CBNplot documentation built on Oct. 10, 2024, 12:21 p.m.
R Package Documentation
Browse R Packages
We want your feedback!
Note that we can't provide technical support on individual packages. You should contact the package authors for that.
CBNplot: Bayesian network plot for the enrichment analysis results
![]()
Plot bayesian network inferred from expression data based on the enrichment analysis results from libraries including clusterProfiler and ReactomePA using bnlearn.
Installation
BiocManager::install("CBNplot")
library(devtools)
install_github("noriakis/CBNplot")
Usage
- Documentation: https://noriakis.github.io/software/CBNplot/
- Web server: ~~https://cbnplot.com~~
- Currently moving to the new server (2024/04/07)
Plot examples
-
The gene-to-gene relationship compared with the reference network.
-
The plot is customizable highliting edges and nodes like hub genes.
-
The example using
MicrobiomeProfiler, thanks to the fix by @xiangpin.
library(MicrobiomeProfiler)
data(Rat_data)
ko.res <- enrichKO(Rat_data)
exp.dat <- matrix(abs(rnorm(910)), 91, 10) %>% magrittr::set_rownames(value=Rat_data) %>% magrittr::set_colnames(value=paste0('S', seq_len(ncol(.))))
exp.dat %>% head
library(CBNplot)
bngeneplot(ko.res, exp=exp.dat, pathNum=1, orgDb=NULL)
- Another customized plot.
R Package Documentation
Browse R Packages
We want your feedback!
Note that we can't provide technical support on individual packages. You should contact the package authors for that.
Embedding an R snippet on your website
Add the following code to your website.
For more information on customizing the embed code, read Embedding Snippets.