In pearsonplc/vispear: A package facilitating data visualisation using Pearson branding
knitr::opts_chunk$set(
  collapse = TRUE,
  comment = "#>",
  fig.path = "README-"
)
Overview
vispear package belongs to the pearsonverse - a set of packages which facilitates the data science process in R. The main goal of this package is to support teams via creating visualisation with standardised and coherent layout. It was built mainly to cooperate with such packages as ggplot2 and DT.
Installation
First install pearsonverse package. It will install all *pear packages.
devtools::install_github("pearsonplc/pearsonverse")
However, if you want to install just vispear package:
devtools::install_github("pearsonplc/vispear")
Main functions
theme_enr() save_plot() & save_plot2() get_html_data() + datatable_enr() show_enr_palettes()
Goals
library(vispear)
library(ggplot2)
1. Creating visualisation with standardised and coherent layout
1.1 theme_enr()
A function which implements a coherent layout to visualisation created by ggplot2 package.
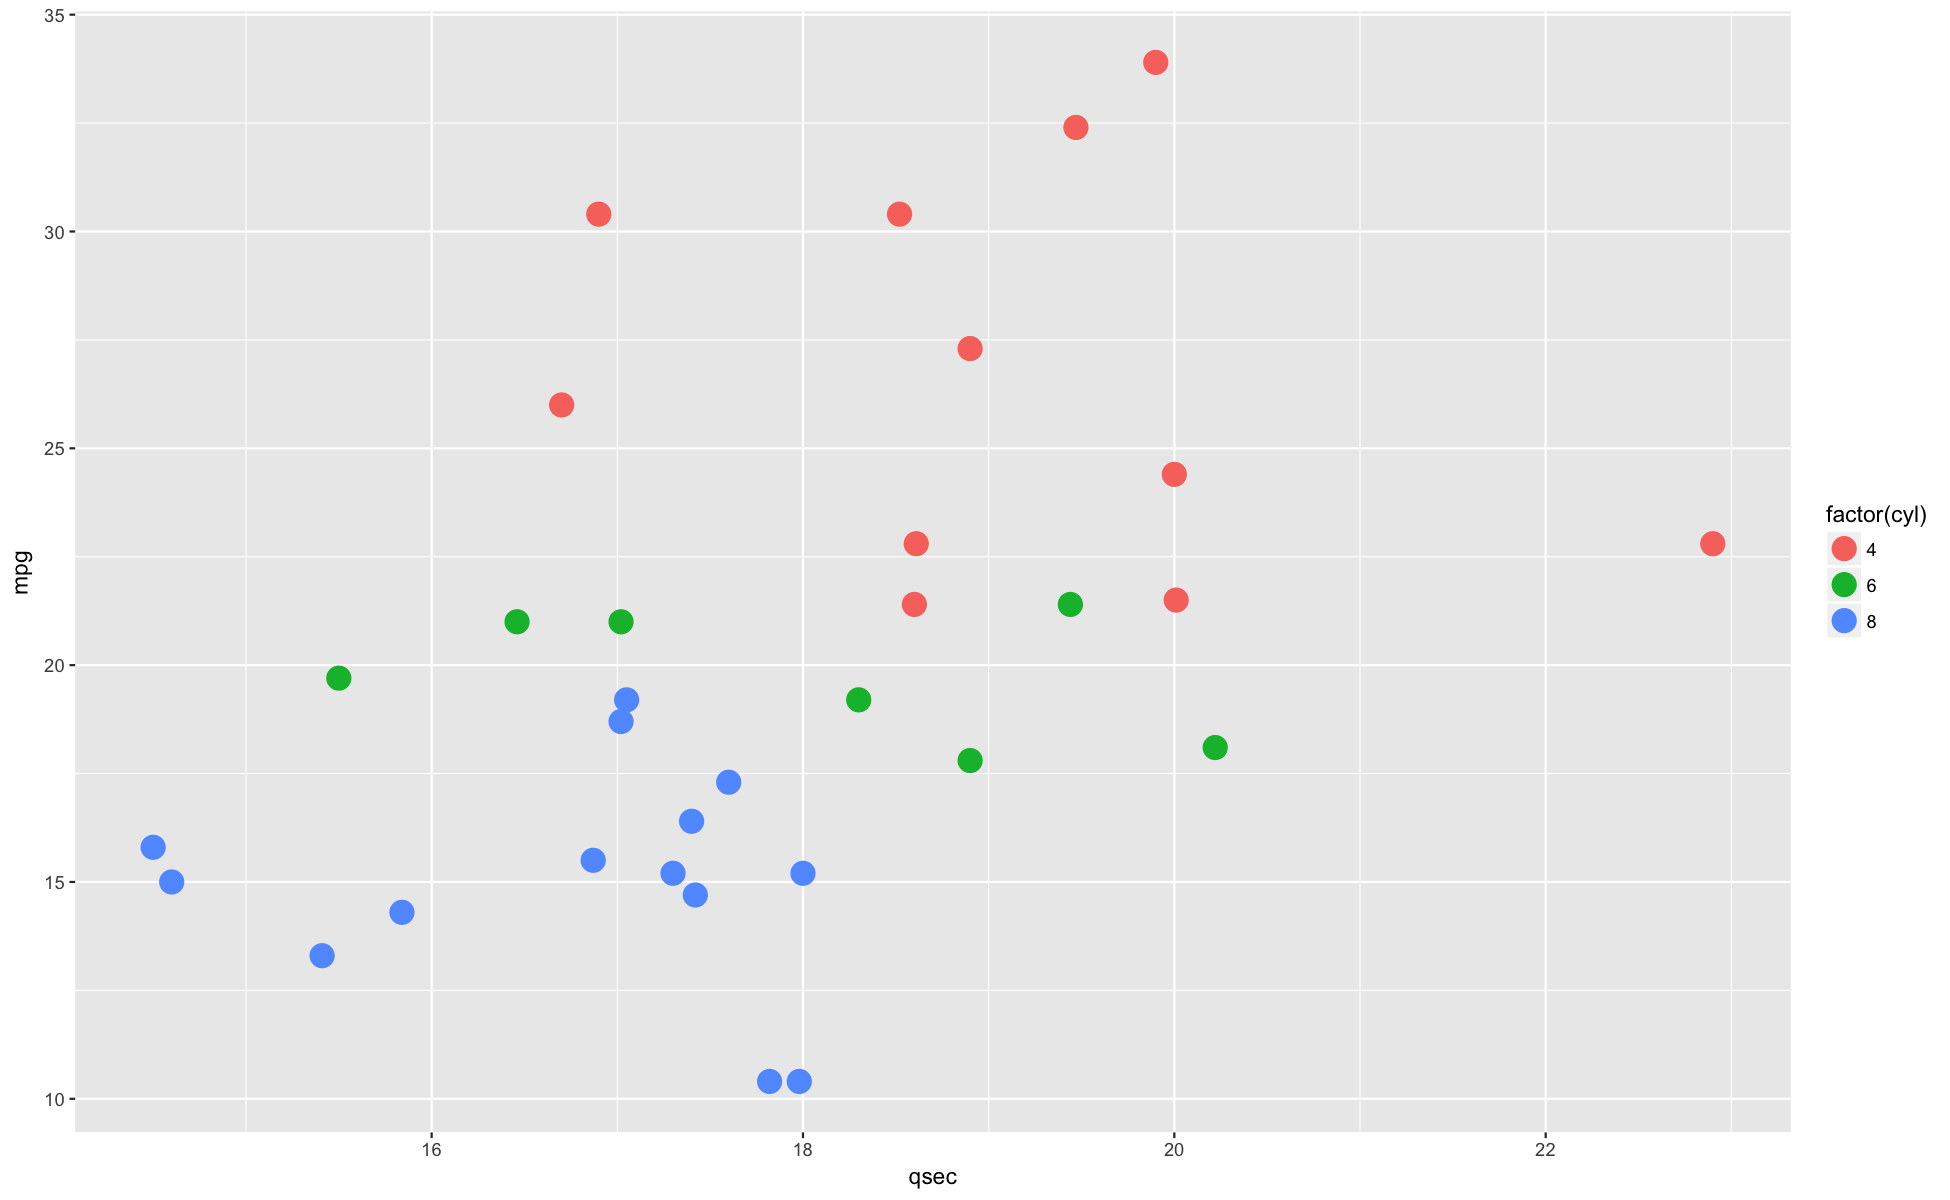
Basic layout
ggplot(mtcars, aes(qsec, mpg, color = factor(cyl))) +
  geom_point(size = 5)
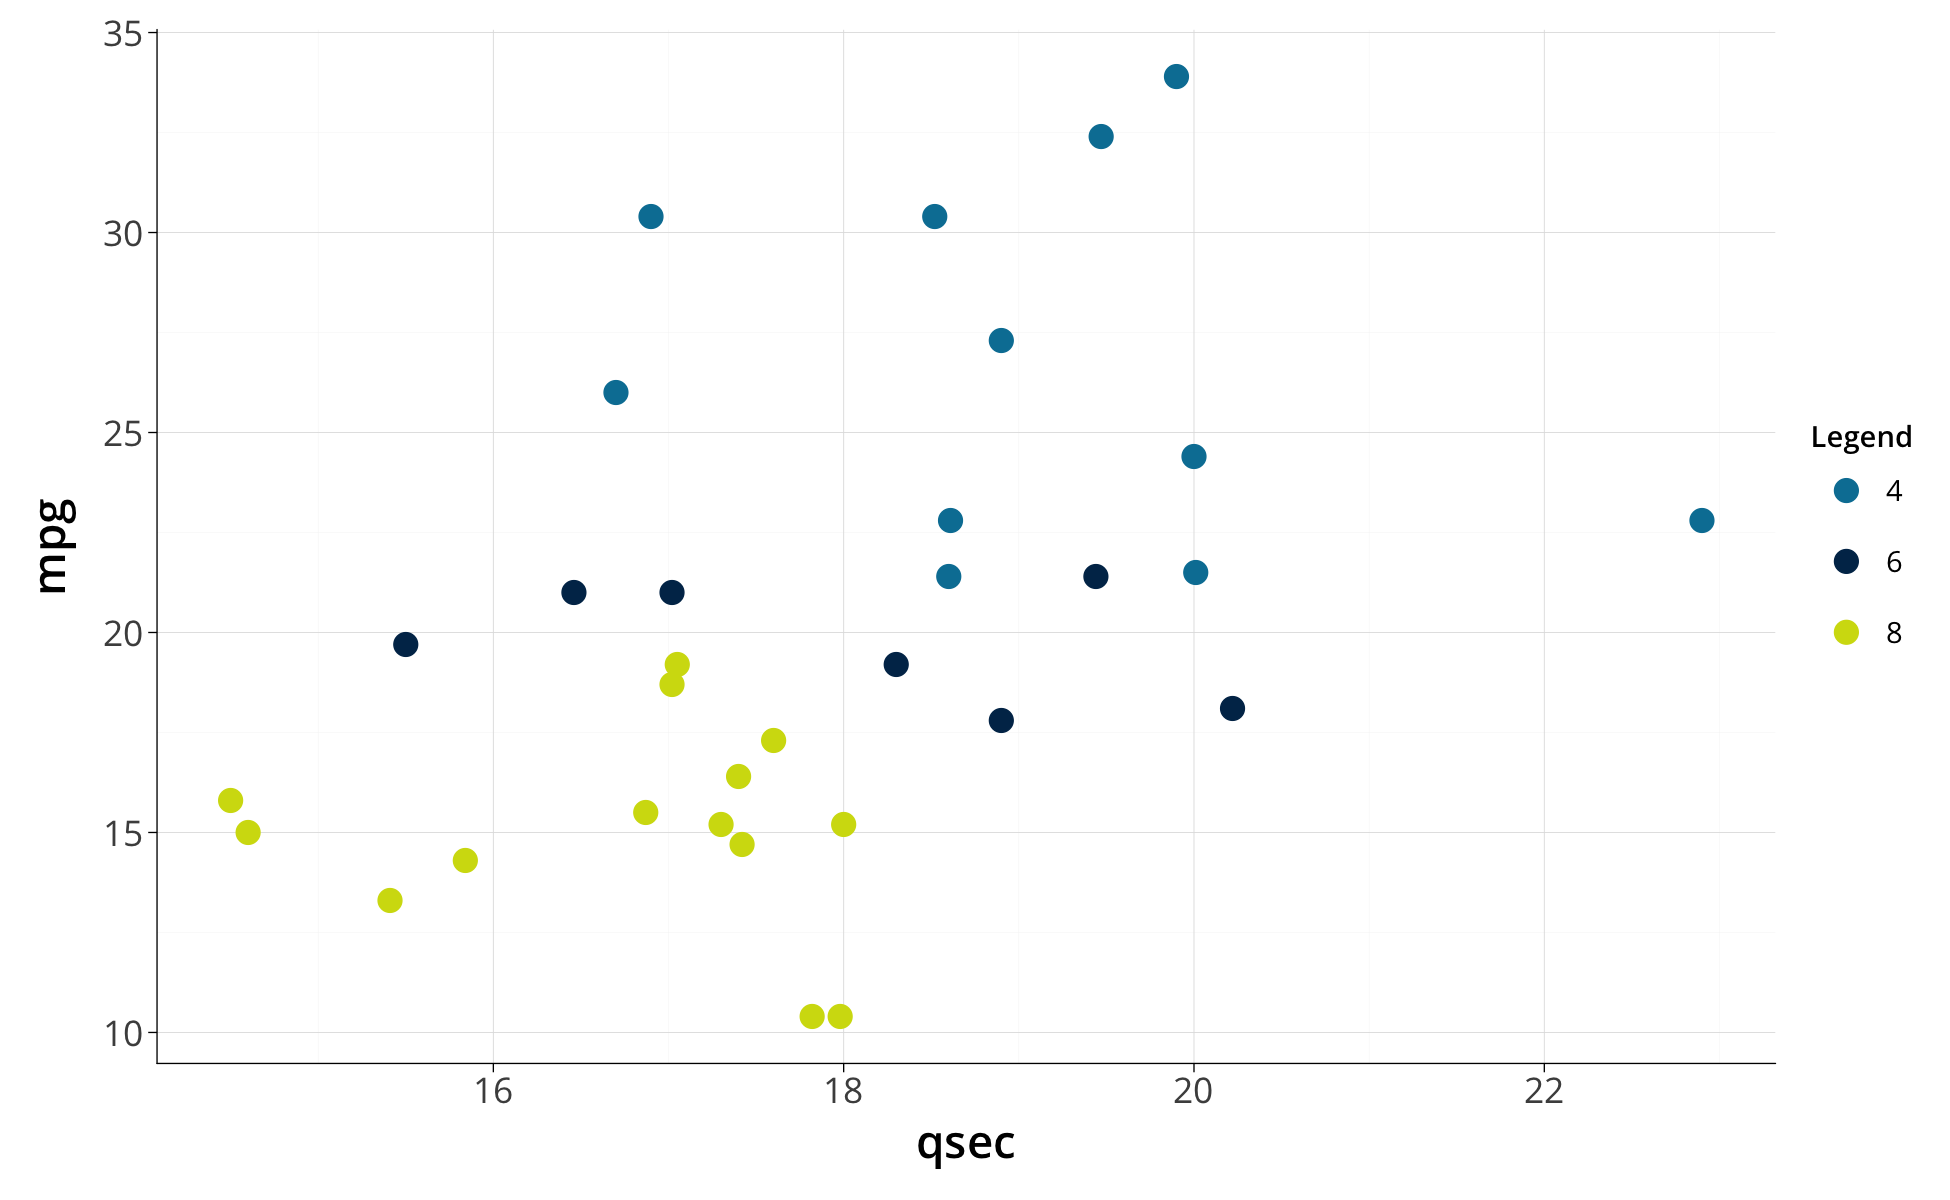
Defined layout
ggplot(mtcars, aes(qsec, mpg, color = factor(cyl))) +
  geom_point() +
  theme_enr(color = p_colors)
1.2 save_plot() & save_plot2()
A pair of functions which allows to save graphs into a file. By default, save_plot saves plot in .png file, and save_plot2 creates two files i.e. in .png and .pdf extensions.
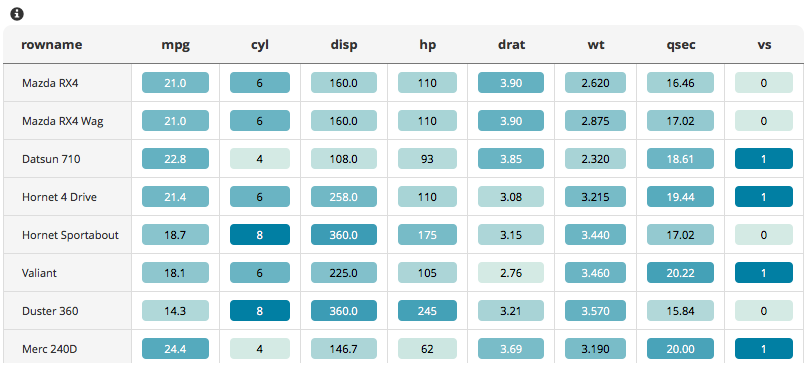
1.3 get_html_data() + datatable_enr()
A pair of functions which allows to create interactive table with coherent layout. It's really useful when you want to add a table in the report. More info here.
1.4 show_enr_palettes()
A function which lists all available defined palettes.
palette_list <- lapply(vispear::show_enr_palettes(), attributes)
data.frame( palette_name = names(palette_list), description = unlist(unname(palette_list)))
pearsonplc/vispear documentation built on May 30, 2019, 3:45 p.m.
R Package Documentation
Browse R Packages
We want your feedback!
Note that we can't provide technical support on individual packages. You should contact the package authors for that.
knitr::opts_chunk$set( collapse = TRUE, comment = "#>", fig.path = "README-" )
Overview
vispear package belongs to the pearsonverse - a set of packages which facilitates the data science process in R. The main goal of this package is to support teams via creating visualisation with standardised and coherent layout. It was built mainly to cooperate with such packages as ggplot2 and DT.
Installation
First install pearsonverse package. It will install all *pear packages.
devtools::install_github("pearsonplc/pearsonverse")
However, if you want to install just vispear package:
devtools::install_github("pearsonplc/vispear")
Main functions
theme_enr()save_plot()&save_plot2()get_html_data() + datatable_enr()show_enr_palettes()
Goals
library(vispear) library(ggplot2)
1. Creating visualisation with standardised and coherent layout
1.1 theme_enr()
A function which implements a coherent layout to visualisation created by ggplot2 package.
Basic layout
ggplot(mtcars, aes(qsec, mpg, color = factor(cyl))) + geom_point(size = 5)
Defined layout
ggplot(mtcars, aes(qsec, mpg, color = factor(cyl))) + geom_point() + theme_enr(color = p_colors)
1.2 save_plot() & save_plot2()
A pair of functions which allows to save graphs into a file. By default, save_plot saves plot in .png file, and save_plot2 creates two files i.e. in .png and .pdf extensions.
1.3 get_html_data() + datatable_enr()
A pair of functions which allows to create interactive table with coherent layout. It's really useful when you want to add a table in the report. More info here.
1.4 show_enr_palettes()
A function which lists all available defined palettes.
palette_list <- lapply(vispear::show_enr_palettes(), attributes) data.frame( palette_name = names(palette_list), description = unlist(unname(palette_list)))
R Package Documentation
Browse R Packages
We want your feedback!
Note that we can't provide technical support on individual packages. You should contact the package authors for that.
Embedding an R snippet on your website
Add the following code to your website.
For more information on customizing the embed code, read Embedding Snippets.