In JGCRI/rfasst: rfasst
The first function of the package is m1_emissions_rescale. It re-scales emissions from GCAM regions to TM5-FASST regions which is the purpose of Module 1.
The function processes emissions outputs from GCAM to make them match with the regional disaggregation of TM5-FASST. Concretely, GCAM emissions are downscaled to country level, using a static downscaling approach based on the gas-specific country-level emissions in the final year available.
For GHGs, we use 2021 emissions reported in the EDGAR v7.0_GHG (1970 - 2021) release from the Emissions Database for Global Atmospheric Research. For air pollutants, we use the country-level emissions in 2017, from the Community Emissions Data System (CEDS), updated for the Global Burden of Disease - Major Air Pollution Sources project CEDS-GBD. This approach is planned to be revised in the future, for example with the implementation of a dynamic GDP-based downscaling procedure linked with the scenario-specific socioeconomic data in GCAM.
Apart from the regional adjustments, this function makes some additional pollutant-related changes such as the transformation of organic carbon into organic matter.
Inputs:
- NonCO2 emissions by sector: By default, they will be automatically queried from the GCAM-database
- NonCO2 emissions from international aviation and international shipping: By default, queried from the GCAM database.
- Mapping of pollutants that are reported by GCAM to more aggregated categories which are input in TM5-FASST (my_pol)
- Mapping of GCAM regions to countries and ISO3 codes for downscaling GCAM results to country-level (GCAM_Reg_Adj)
- Mapping of TM5-FASST regions to ISO3 country codes for re-grouping country-level downscaled emissions (fasst_reg)
- Shares to distribute emissions of different species between Russia Eastern (RUE) and Western (RUS) (adj_rus)
Outputs:
The function produces re-scaled emissions of the main pollutants for each period and TM5-FASST region. If saveOutput is set to TRUE, the function writes the following csv files in the output/m1 sub-directory: [scenario]_[year].csv
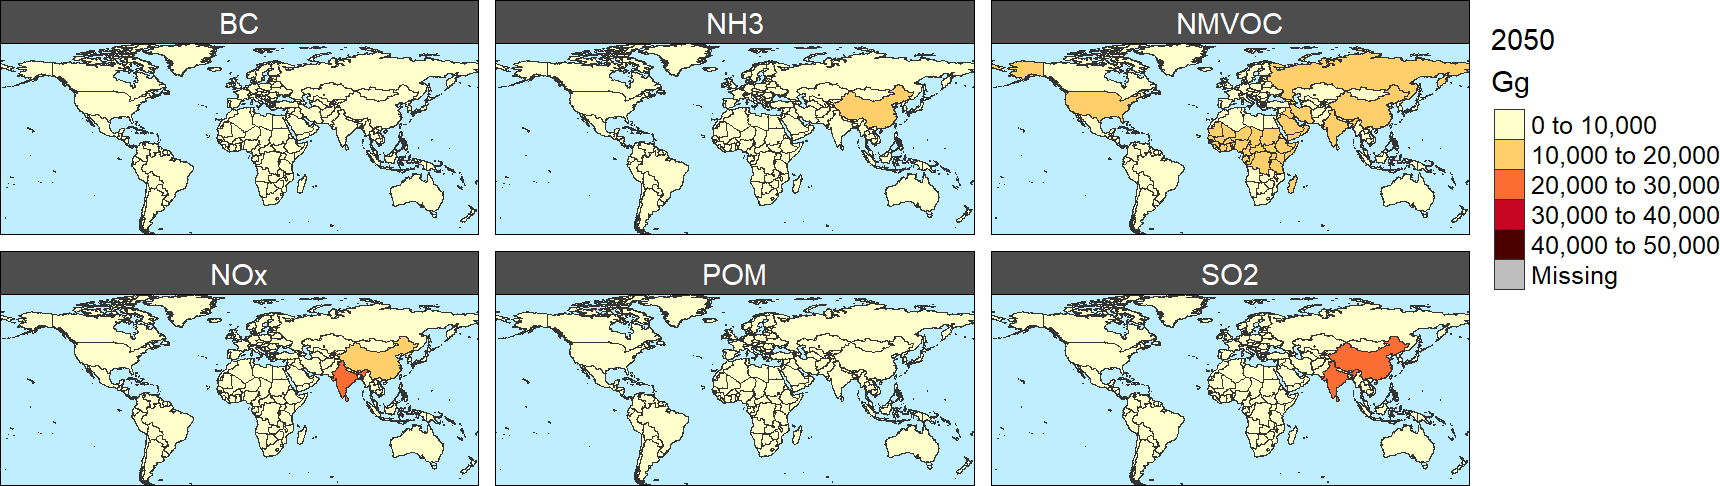
In addition, by setting map to TRUE, the function generates air pollutant emission maps by year and specie, using the rmap package documented in the following page. The function also
generates animations and individual figures for each pollutant by modifying the mapIndivPoland anim parameters.
The outputs from this module generated with the function m1_emissions_rescale are going to read by the set of functions in Module 2, which calculate PM2.5 and O3 average concentration levels based on these emission sets.
knitr::opts_chunk$set(
  collapse = TRUE,
  comment = "#>"
)
library(rfasst)
library(magrittr)

 db_path<-"path_to_your_gcam_database"
 query_path<-"path_to_your_gcam_queries_file"
 db_name<-"name of the database"
 prj_name<-"name for a Project to add extracted results to" # (any name should work, avoid spaces just in case)
 scen_name<-"name of the GCAM scenario"
 queries<-"Name of the query file" # (the package includes a default query file that includes all the queries required in every function in the package, "queries_rfasst.xml")

   #To write the re-scaled emissions (csv files) for all years into the output folder:
     m1_emissions_rescale(db_path,query_path,db_name,prj_name,scen_name,queries,saveOutput=T, map=T,mapIndivPol=F, anim=T )

   #To save as data frame emisions of main pollutants by TM5-FASST region in 2050:

     em.2050<-dplyr::bind_rows(m1_emissions_rescale(db_path,query_path,db_name,prj_name,scen_name,queries,saveOutput=F)) %>% dplyr::filter(year==2050)

     head(m1_emissions_rescale)
*Air pollutant emissions by specie in 2050 (Gg)*
JGCRI/rfasst documentation built on Feb. 2, 2023, 12:14 a.m.
R Package Documentation
Browse R Packages
We want your feedback!
Note that we can't provide technical support on individual packages. You should contact the package authors for that.
The first function of the package is m1_emissions_rescale. It re-scales emissions from GCAM regions to TM5-FASST regions which is the purpose of Module 1.
The function processes emissions outputs from GCAM to make them match with the regional disaggregation of TM5-FASST. Concretely, GCAM emissions are downscaled to country level, using a static downscaling approach based on the gas-specific country-level emissions in the final year available. For GHGs, we use 2021 emissions reported in the EDGAR v7.0_GHG (1970 - 2021) release from the Emissions Database for Global Atmospheric Research. For air pollutants, we use the country-level emissions in 2017, from the Community Emissions Data System (CEDS), updated for the Global Burden of Disease - Major Air Pollution Sources project CEDS-GBD. This approach is planned to be revised in the future, for example with the implementation of a dynamic GDP-based downscaling procedure linked with the scenario-specific socioeconomic data in GCAM.
Apart from the regional adjustments, this function makes some additional pollutant-related changes such as the transformation of organic carbon into organic matter.
Inputs:
- NonCO2 emissions by sector: By default, they will be automatically queried from the GCAM-database
- NonCO2 emissions from international aviation and international shipping: By default, queried from the GCAM database.
- Mapping of pollutants that are reported by GCAM to more aggregated categories which are input in TM5-FASST (my_pol)
- Mapping of GCAM regions to countries and ISO3 codes for downscaling GCAM results to country-level (GCAM_Reg_Adj)
- Mapping of TM5-FASST regions to ISO3 country codes for re-grouping country-level downscaled emissions (fasst_reg)
- Shares to distribute emissions of different species between Russia Eastern (RUE) and Western (RUS) (adj_rus)
Outputs:
The function produces re-scaled emissions of the main pollutants for each period and TM5-FASST region. If saveOutput is set to TRUE, the function writes the following csv files in the output/m1 sub-directory: [scenario]_[year].csv
In addition, by setting map to TRUE, the function generates air pollutant emission maps by year and specie, using the rmap package documented in the following page. The function also
generates animations and individual figures for each pollutant by modifying the mapIndivPoland anim parameters.
The outputs from this module generated with the function m1_emissions_rescale are going to read by the set of functions in Module 2, which calculate PM2.5 and O3 average concentration levels based on these emission sets.
knitr::opts_chunk$set( collapse = TRUE, comment = "#>" )
library(rfasst) library(magrittr) db_path<-"path_to_your_gcam_database" query_path<-"path_to_your_gcam_queries_file" db_name<-"name of the database" prj_name<-"name for a Project to add extracted results to" # (any name should work, avoid spaces just in case) scen_name<-"name of the GCAM scenario" queries<-"Name of the query file" # (the package includes a default query file that includes all the queries required in every function in the package, "queries_rfasst.xml") #To write the re-scaled emissions (csv files) for all years into the output folder: m1_emissions_rescale(db_path,query_path,db_name,prj_name,scen_name,queries,saveOutput=T, map=T,mapIndivPol=F, anim=T ) #To save as data frame emisions of main pollutants by TM5-FASST region in 2050: em.2050<-dplyr::bind_rows(m1_emissions_rescale(db_path,query_path,db_name,prj_name,scen_name,queries,saveOutput=F)) %>% dplyr::filter(year==2050) head(m1_emissions_rescale)
*Air pollutant emissions by specie in 2050 (Gg)*
R Package Documentation
Browse R Packages
We want your feedback!
Note that we can't provide technical support on individual packages. You should contact the package authors for that.
Embedding an R snippet on your website
Add the following code to your website.
For more information on customizing the embed code, read Embedding Snippets.